IMAGE

Fig. 3

ID
ZDB-IMAGE-200310-38
Source
Figures for Stratman et al., 2020
Image
Figure Caption

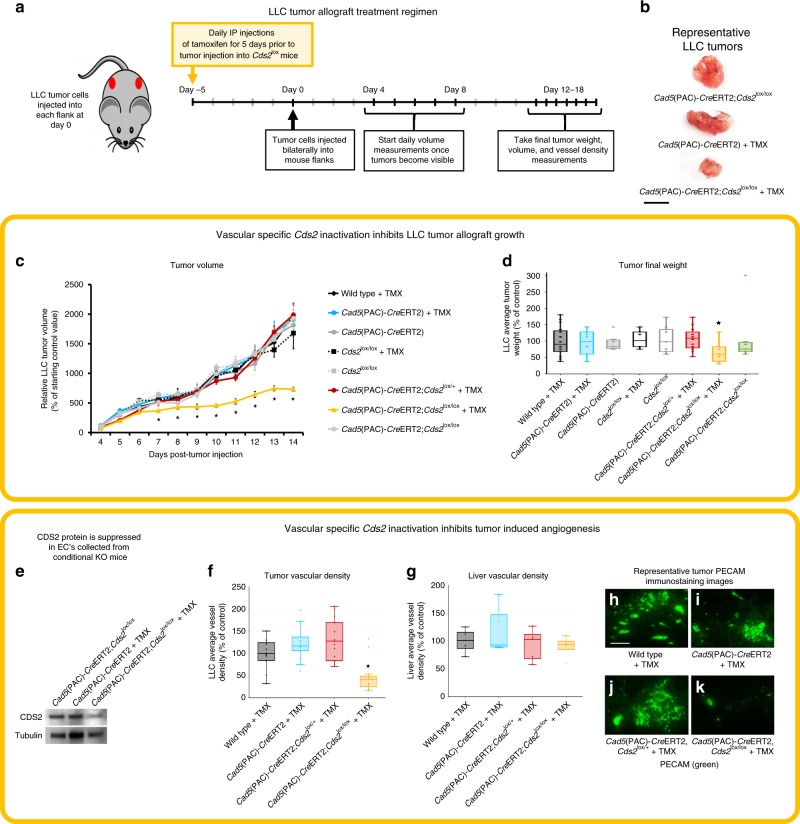
Fig. 3 Endothelial-specific genetic deletion of <italic>Cds2</italic> promotes tumor growth inhibition.

a Schematic of Lewis Lung Carcinoma (LLC) tumor allograft assay in endothelial-specific Cds2 knockout mice. b Representative tumor images from Vehicle Control (Cad5(PAC)-CreERT2;Cds2lox/lox); Cre, TMX Control (Cad5(PAC)-CreERT2 +TMX); and endothelial-specific Cds2 genetic deletion mice (Cad5(PAC)-CreERT2;Cds2lox/lox +TMX). Bar = 1 cm. c, d Quantitation of LLC average tumor volume (c) and final tumor weight (d) at 14 days post- tumor implantation in the eight genetic conditions tested. Data in c are normalized to the starting day 4 tumor volume of Wild type + TMX controls. e Representative western blot images of EC protein isolated from tumors for each indicated genetic condition, probed for CDS2 and tubulin as a loading control. Blots demonstrate that CDS2 protein is still reduced in Cad5(PAC)-CreERT2;Cds2lox/lox mice at day 14, after only a 5 day pulse of TMX treatment initiated prior to the start of the experiment. p ≤ 0.05, error bars ± SEM. *Significance from control (t-test). f, g Quantitation of average tumor vascular density (f) and average liver vascular density (g) of CD31/PECAM labeled LLC tumor and liver sections from control Wild type +TMX, control Cad5(PAC)-CreERT2 +TMX, control Cad5(PAC)-CreERT2;Cds2lox/+ +TMX, and endothelial-specific Cds2 genetic deletion Cad5(PAC)-CreERT2;Cds2lox/lox +TMX mice. For all vascular density measurement experiments: three images per tumor were acquired and vascular density measured for all groups. A minimum of two slide sections from each tumor (taken from sections at least 10 slices apart) were analyzed. p ≤ 0.05, error bars ± SEM. Star indicates significance from control (t-test). hk Representative images of CD31/PECAM labeled blood vessels in tumors from control Wild type +TMX, control Cad5(PAC)-CreERT2 +TMX, control Cad5(PAC)-CreERT2;Cds2lox/+ +TMX, and endothelial-specific Cds2 genetic deletion Cad5(PAC)-CreERT2;Cds2lox/lox +TMX mice. Bar =100 μm. Naming key: Wild type + TMX (no Cre, no Cds2 lox cassette; n = 18); Cad5(PAC)-CreERT2 +TMX (CreiECΔ only, +TMX; n = 13); Cad5(PAC)-CreERT2 (CreiECΔ only, no TMX vehicle control; n = 9); Cds2lox/lox +TMX (only homozygous Cds2 lox cassette, +TMX, no Cre; n = 6); Cds2lox/lox (only homozygous Cds2 lox cassette, no TMX vehicle control; n = 9); Cad5(PAC)-CreERT2;Cds2lox/+ +TMX (CreiECΔ, Cds2 heterozygous lox cassette, +TMX; n = 16); Cad5(PAC)-CreERT2;Cds2lox/lox +TMX (homozygous lox cassette, CreiECΔ, +TMX− experimental deletion group; n = 12); Cad5(PAC)-CreERT2;Cds2lox/lox (homozygous lox cassette, CreiECΔ, no TMX vehicle control; n = 7). Box plots are graphed showing the median versus the first and third quartiles of the data (the middle, top, and bottom lines of the box, respectively). The whiskers demonstrate the spread of data within 1.5x above and below the interquartile range. All data points are shown as individual dots, with outliers shown above or below the whiskers.

Acknowledgments
This image is the copyrighted work of the attributed author or publisher, and ZFIN has permission only to display this image to its users. Additional permissions should be obtained from the applicable author or publisher of the image. Full text @ Nat. Commun.