
|
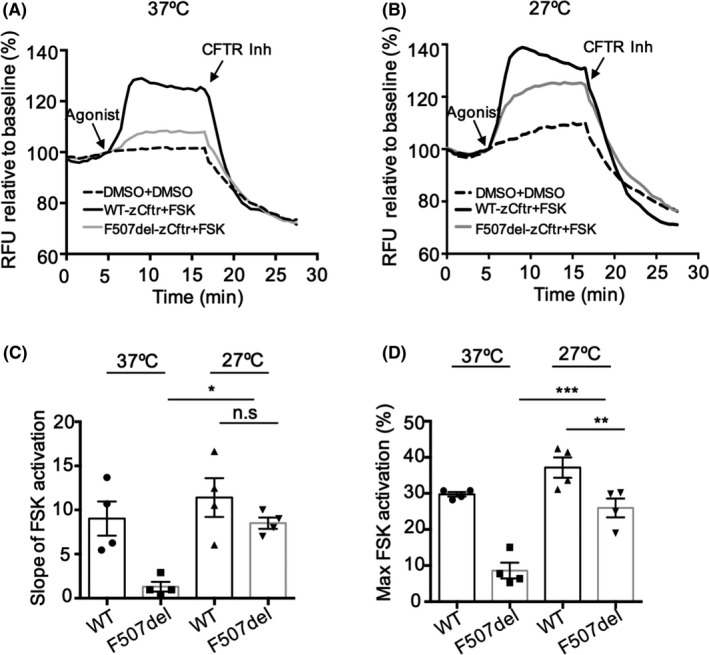
Figure 3
Activation of F507del‐zCftr exhibits full rescue after low temperature rescue. Functional analysis using the fluorometric imaging plate reader membrane depolarization assay of WT‐or F507del‐zCftr‐GFP in the presence of 0.1% DMSO or 10 μM of FSK in HEK293 cells at 37°C (A) or 27°C (B). After 10 min activation by FSK, CFTR Inhibitor (CFTRinh‐172, 10 μM) was added to deactivate CFTR. (C) Bar graph shows the mean (±SEM) of the slope of FSK activation at 37°C and 27°C (n = 4). (D) Bar graphs show the mean (±SEM) of maximal activation of CFTR after stimulation by FSK at 37 and 27°C (n = 4). (*