IMAGE

Fig. 3

ID
ZDB-IMAGE-200306-69
Source
Figures for Truong et al., 2020
Image
Figure Caption

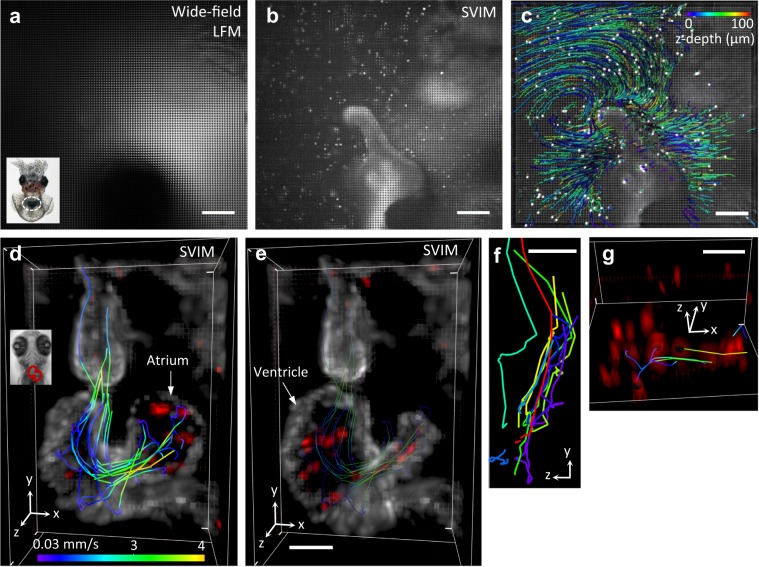
Fig. 3 SVIM enables fast, high-contrast, volumetric imaging of live biological systems.

ac Imaging the bacterial flow around the light organ of a juvenile squid. Raw light-field images recorded with conventional wide-field illumination yielded excessive background a, whereas SVIM, with a selectively illuminated volume of 100 µm, reduced this background and enhanced the contrast to allow localization of individual bacteria b. Inset shows squid with the light organ region highlighted by the dashed oval. c Quantitative flow trajectories tracked from the reconstructed SVIM data, color-coded for z-depth. Non-uniform 3D flow patterns were observed throughout the imaged volume. Images were collected at 20 volumes s−1, with a volume ~600 × 600 × 100 µm3 (depth). dg Imaging the motions of the beating heart wall and moving blood cells. A volume of ~250 × 150 × 150 µm3 (depth) in a live 5 dpf zebrafish larva was captured at 90 volumes s−1. Transgenes labeled the endocardium (rendered white) and blood cells (rendered red), Tg(kdrl:eGFP, gata1:dsRed). Inset in d highlights the position of the heart within the animal. The captured beating heart is shown in 3D-rendered views at two representative time points during the cardiac cycle: d the atrium was at its fullest expanded extent, followed by e when the blood had been pumped into the enlarged ventricle. Representative blood cell flow trajectories were manually tracked and quantified (color of the trajectories in d, e, g depicts blood cell speed; Methods section). f Maximum projection image along the x-axis of several representative flow trajectories highlights the substantial component of blood flow along the z-direction. To aid visualization, clipping planes in the yz plane were used to cut out the atrium and parts of the ventricle. Color-coding of the blood cell tracks in f is only for visual identification. g Perspective view of the blood cells demonstrates the achieved single-cell resolution, notably along the z-direction. Circular voids within several blood cells mark the cells whose trajectories were tracked and quantified. Scale bars, (ac) 100 µm, (dg) 50 µm.

Acknowledgments
This image is the copyrighted work of the attributed author or publisher, and ZFIN has permission only to display this image to its users. Additional permissions should be obtained from the applicable author or publisher of the image. Full text @ Commun Biol