IMAGE

Figure 2

ID
ZDB-IMAGE-200306-100
Source
Figures for Moreira et al., 2020
Image
Figure Caption

Figure 2

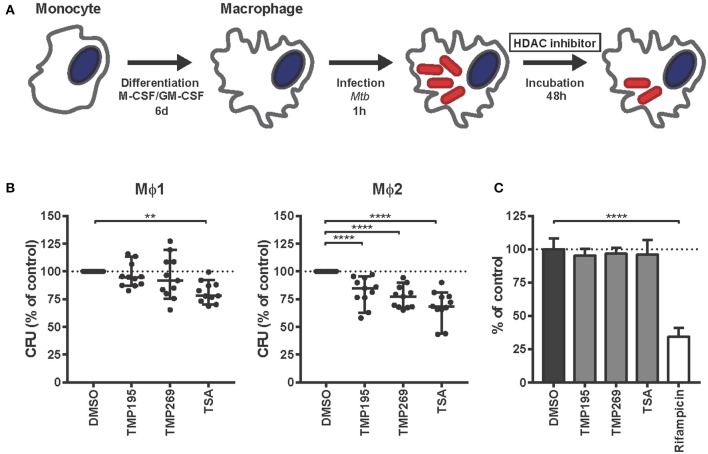
HDAC inhibitors decrease Mtb survival in human macrophages in a host-directed manner. (A) Schematic outline of the experimental setup used in (B). (B) Mϕ1 and Mϕ2 macrophages derived from 11 different donors were infected with Mtb for 1 h at MOI 10 and treated with TMP195 (10 μM), TMP269 (10 μM), TSA (100 nM), or DMSO at equal v/v for 48 h post-infection. Dots represent the mean of 3 CFU assay replicates of a single donor expressed as a percentage of the DMSO control. Horizontal lines indicate median CFU values of all 11 donors and whiskers represent 95% confidence intervals. Statistically significant differences compared to DMSO were tested using a RM one-way ANOVA (**p < 0.01, ****p < 0.0001). (C) Thirteen days treatment of a Mtb broth culture in the presence of 10 μM TMP195, TMP269, or TSA. Rifampicin (20 μg/ml) was used as a positive control. Bars depict the mean bacterial density at 550 nm ± standard deviation of six replicates from a representative experiment out of two independent experiments. The bacterial load is expressed as a percentage of the DMSO control value. Statistically significant difference compared to DMSO was tested using a one-way ANOVA with Dunnett's multiple test correction (****p < 0.0001).

Acknowledgments
This image is the copyrighted work of the attributed author or publisher, and ZFIN has permission only to display this image to its users. Additional permissions should be obtained from the applicable author or publisher of the image. Full text @ Front Immunol