
|
Figure 2
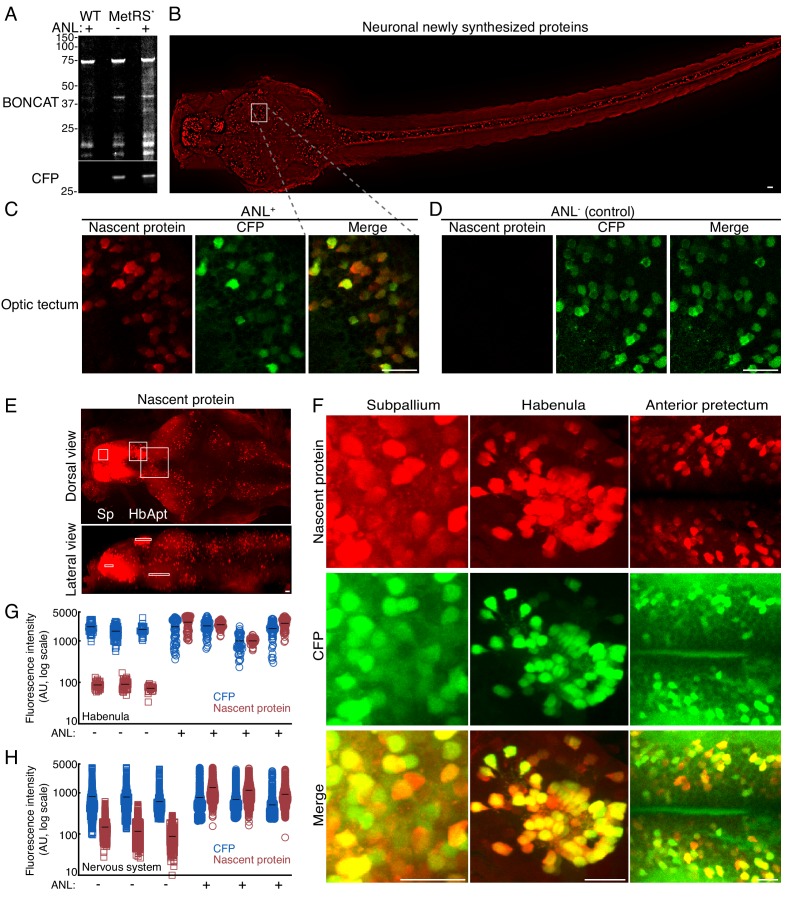
High resolution imaging newly synthesized proteins in different neuronal populations.
3 dpf larvae were incubated with 10 mM ANL for 24 hr in vivo, fixed (at 4 dpf) and clicked to a biotin tag for BONCAT or a fluorescent tag to visualize nascent proteins in situ. (A) Immunoblot detecting newly synthesized proteins in WT larvae treated with ANL (WT ANL+, control), MetRSL270G (MerRS*) larvae treated with ANL (ANL +) or not (ANL-, control). (B) Dorsal view collage projection of confocal images showing fluorescently labeled newly synthesized neuronal proteins (red). (C-F) High magnification view of different brain regions. 4–6 confocal planes are shown (~10 microns in depth). Note the overlap between the CFP channel (Ab staining, green) and the nascent protein channel (click labeling, red), indicating that the signal is specific to cells expressing the MetRSL270G. (C-D) Optic tectum (Ot). (C) Shown are 4 planes of the region indicated by the square in B. (D) The same region in a larva not incubated with ANL demonstrating the CFP but not nascent protein labeling. (E) Maximal projection of labelled newly synthesized proteins in an entire brain (dorsal view and lateral view) (see Figure 2—figure supplement 2A–B for lower brightness). White frames indicate the subpallium (Sp), habenula (Hb) and anterior pretectum (Apt), regions zoomed in (in F). (F) CFP Ab staining and nascent protein labeling in 4–6 confocal images indicated in the white frames in E. See Figure 2—figure supplement 2for more brain regions. (G-H) Quantification of the average nascent protein levels in the habenula (G) and the entire nervous system (H). Neurons were segmented in 3D using the CFP channel (see supplementary material and Figure 2—figure supplements 6–7) and the average voxel fluorescence intensity for the CFP and fluorescently labeled nascent protein was measured in each cell. Plotted are the average fluorescence intensities in single cells. 30 to 60 neurons were segmented for each habenula of 4 ANL-treated and 3 control larvae (G). (H) Quantification of the average CFP and nascent protein fluorescence intensity in neurons across the entire nervous system. More than 1000 neurons were segmented in 3D using the CFP channel (similar to G). Plotted are the mean fluorescence intensities in single cells from 3 larvae treated (ANL+, squares) or not treated (ANL-, circles) with ANL. See Figure 2—figure supplement 5 for statistical differences between the groups. Squares: ANL- (control), circles: ANL+, blue: CFP, red: Nascent protein, black line – mean fluorescence intensity within a single larva. One cell had a nascent protein intensity value below ten and is shown on the x-axis. Scale bars = 20 μm.