IMAGE

Figure 3

ID
ZDB-IMAGE-200304-12
Source
Figures for Shahar et al., 2020
Image
Figure Caption

Figure 3 Newly synthesized proteins following different durations of metabolic labeling.

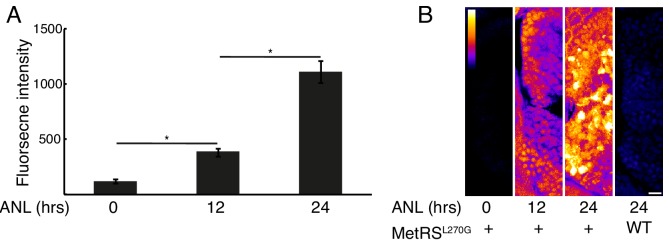
Larvae were incubated with 10 mM ANL in their water bath for the indicated durations before fixation and click reaction. (A) Neurons in the habenula of MetRSL270G larvae were segmented in 3D using the CFP channel and the fnascent proteinintensity was measured in each neuron. Plotted are the average intensities of 3 larvae for each treatment (N = 3 for each treatment). Error bars indicate the SEM (N = 3). *p<0.05 (0.005 for 12 hr and 0.009 for 24 hr). (B) Representative images. Shown are maximal projections of 10 planes (~4 μm) of confocal images in the nascent proteins channel of the forebrain focusing on the olfactory bulb. Calibration bar – top left, scale bar = 10 μm.

Source data for <xref rid='fig3' ref-type='fig'>Figure 3A</xref>.

Acknowledgments
This image is the copyrighted work of the attributed author or publisher, and ZFIN has permission only to display this image to its users. Additional permissions should be obtained from the applicable author or publisher of the image. Full text @ Elife