Image
Figure Caption

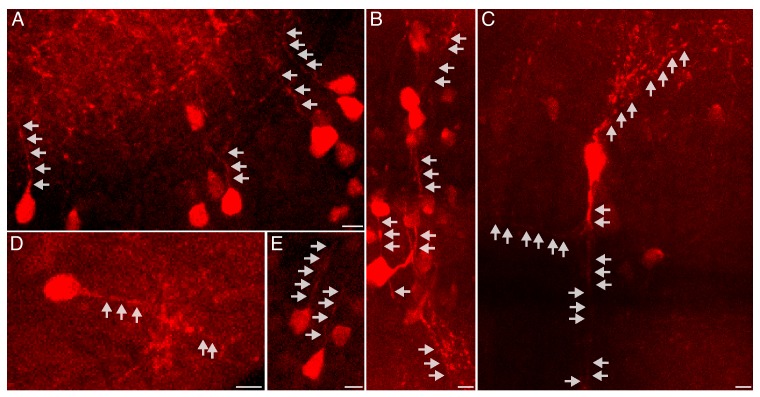
Figure 2—figure supplement 8. Detection of nascent protein in neuronal processes.

Representative images of cells exhibiting labeling of nascent proteins in neurites. Maximum intensity projections of 3–6 confocal planes (5.7–12 microns) are shown. Freely swimming larvae were incubated with ANL for 24 hr (same larvae as in Figures 2 and 3). Click chemistry was performed to label nascent proteins prior to imaging. Nascent proteins in neuronal processes were detected in different brain regions including optic tectum (A, note the staining in the neuropil in the top left corner), Mauthner cells (B, C), hindbrain (D) and forebrain (E). Gray arrows indicate neurites. Scale bars = 5 μm.

Acknowledgments
This image is the copyrighted work of the attributed author or publisher, and ZFIN has permission only to display this image to its users. Additional permissions should be obtained from the applicable author or publisher of the image. Full text @ Elife