IMAGE

Fig. 3

ID
ZDB-IMAGE-200302-9
Source
Figures for Fazilaty et al., 2019
Image
Figure Caption

Fig. 3

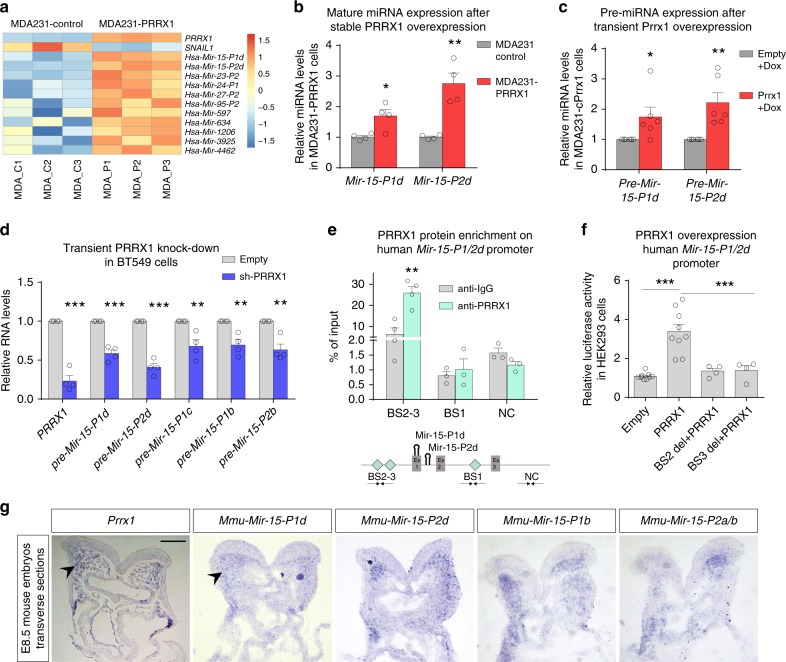
Prrx1 directly induces the expression of miR-15 family. a Heatmap showing Robust Multi-array Average (RMA) normalized probe intensity values of PRRX1, SNAIL1, and selected miRNAs in MDA231 cells, with three control samples (MDA_C1 to C3) and three samples in which PRRX1 was overexpressed (MDA_P1 to P3). The intensities mapped as color scale show normalized fold change with respect to the average (n = 3). b Validation by Taq-Man qPCR of Mir-15-P1d and Mir-15-P2d upregulation after PRRX1 stable overexpression in MDA231 cells lines, using specific probes to detect the mature miRNAs (n = 4). cMir-15-P1d_pre and Mir-15-P2d_pre upregulation upon conditional (Dox-mediated) Prrx1 overexpression in MDA231 cells (n = 6). d qPCR assay showing downregulation of PRRX1 and premiRNAs transcription upon transient knockdown (KD) of PRRX1 in BT549 cells. PRRX1 shRNA plus YFP transfected cells were sorted after 4 days (n = 4). e PRRX1 directly binds to the human Mir-15-P1/2d promoter as shown by ChIP assay in BT549 cells using a PRRX1 specific antibody. Cyan diamonds in the schematic map represent distances between PRRX1 potential BSs and the promoter potential motifs, TAATKDS, on Mir-15-P1/2d promoter. (BS1: −293, BS2: −949, BS3: −1451 and NC: +1893). Ex1–3 represent exons of the host long noncoding RNA MIR503HG. Arrows represent primer sets used for ChIP detection. (n = 3 except for BS2–3 for which n = 4). f Activation of human Mir-15-P1/2d promoter by PRRX1 overexpression shown by dual luciferase assay in HEK293 cells. This activation is abolished upon deletion of the PRRX1 binding sites in Mir-15-P1/2d promoter (del1/2 + PRRX1) (n = 4 except for deletions for which n = 4). g Transverse sections of the cranial region of E8.5 embryos showing the expression of Prrx1, Mir-15-P1d, Mir-15-P2d, Mir-15-P1b, and Mir-15-P2a/b in similar regions (arrowheads). Scale bar: 100 μm. Dox doxycycline, sh short hairpin RNA (shRNA), BS binding site, del deletion. Bars represent mean plus SEM, indicated (n) represent number of independent experiments as biological replicates and asterisks indicate significant p value in t test for (be) and one-way ANOVA with Bonferroni’s multiple comparison test for (f). (*p < 0.05, **p < 0.01 and ***p < 0.001). Source data are provided as a Source Data file

Acknowledgments
This image is the copyrighted work of the attributed author or publisher, and ZFIN has permission only to display this image to its users. Additional permissions should be obtained from the applicable author or publisher of the image. Full text @ Nat. Commun.