IMAGE

Fig. 1

ID
ZDB-IMAGE-200302-7
Source
Figures for Fazilaty et al., 2019
Image
Figure Caption

Fig. 1

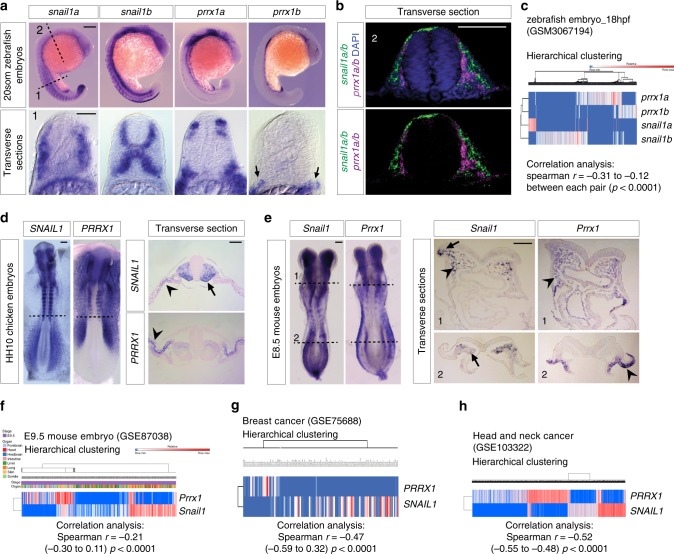
Snail1 and Prrx1 complementary expression in development and disease. a Lateral view of 20-somite zebrafish embryos showing snail1a, snail1b, prrx1a and prrx1b expression in whole-mount (top) and transverse sections (1), showing complementary patterns in somites. b Transverse section of a zebrafish embryo in the cranial neural crest region showing complementary expression of snail1a/b (green) and prrx1a/b (red) taken at the level indicated by (2) in (a) with or without DAPI staining (nuclei). c Heatmap showing hierarchical clustering of scRNA-seq data from 18 hpf zebrafish embryos, from public database GEO: GSM3067194, with significant negative correlations between gene pairs (detailed in Supplementary Fig. 1a). d Dorsal view of HH10 chicken embryos showing PRRX1 and SNAIL1 expression in whole-mount and transverse sections at the level indicated by dashed lines, showing complementary patterns for SNAIL1 and PRRX1 In the somites (arrow) and in the LPM (splanchnopleura and somatopleura, respectively; arrowheads). e Expression of Snail1 and Prrx1 in dorsal views of E8.5 mouse embryos. Transverse sections of E8.5 embryos from the regions indicated by dashed lines (anterior and posterior, 1 and 2, respectively), showing complementary expression of Snail1 and Prrx1 in premigratory (1, arrow), and migratory (1, arrowheads) neural crest (PNC and MNC, respectively) and mesodermal populations including presomitic mesoderm (2, arrow) and lateral plate mesoderm (2, arrowhead). f Hierarchical clustering heatmaps of scRNA-seq data from E9,5 mouse embryos for Snail1 and Prrx1 expression (GEO: GSE87038), showing a significant negative correlation. This dataset contains cells from different embryonic tissues, shown in different colors. g, h Heatmaps of hierarchical clusterings of single-cell RNA sequencing data from public datasets of breast (GEO: GSE75688) and head and neck carcinoma (GEO: GSE103322), showing mutually exclusive expression of Snail1 and Prrx1. The color scale shown in (f) is also valid for (g) and (h), representing the normalized values for the number of reads. Scale bars: 250 μm for whole mounts and 100 μm for sections. Statistical analyses for scRNA-seq data has been done using Spearman r correlation test, scRNA-seq single-cell RNA sequencing, vs. versus, hpf hours post fertilization. Source data are provided as a Source Data file

Acknowledgments
This image is the copyrighted work of the attributed author or publisher, and ZFIN has permission only to display this image to its users. Additional permissions should be obtained from the applicable author or publisher of the image. Full text @ Nat. Commun.