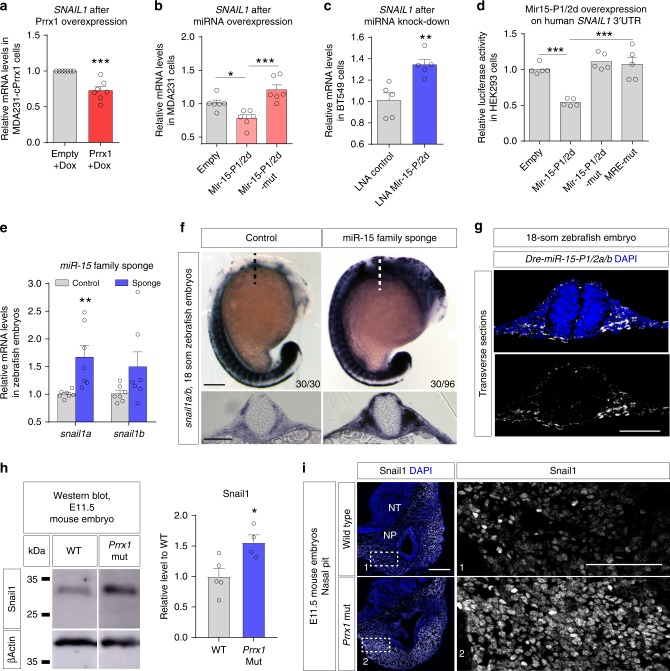
IMAGE

Fig. 4

ID
ZDB-IMAGE-200302-10
Source
Figures for Fazilaty et al., 2019
Image
Figure Caption

Fig. 4

Prrx1 attenuates Snail1 expression through the activation of miR-15 family members. a qPCR assay showing the downregulation of SNAIL1 upon conditional overexpression of Prrx1 in MDA231, induced by doxycycline after 48 h (n = 7). b qPCR assay showing downregulation of SNAIL1 upon transient overexpression of Mir-15-P1/2d in MDA231 cells, using seed mutated miRNAs as control (Mir-15-P1/2d-mut) (n = 6). c qPCR assay showing upregulation of SNAIL1 upon transient KD of in Mir-15-P1/2d in BT549 cells using miRNA LNA inhibitors (n = 5). d Repression of human SNAIL1 3′ UTR after Mir-15-P1/2d overexpression, using seed mutated miRNAs (Mir-15-P1/2d-mut) or MRE mutant SNAIL1 3-UTR (MRE-mut) as control (n = 5). e qPCR analysis shows upregulation of snail1a/b expression in the sponge-injected (miR-15 family knocked-down) zebrafish embryos compared to controls (n = 6). f 20-somite control or miR-15 family sponge-injected zebrafish embryos showing combined snail1a/b expression by in situ hybridization. Transverse sections taken at the levels indicated by the dashed lines. Scale bar: 250 μm. g Fluorescent miRNA in situ hybridization to detect mature miRNAs in transverse sections of 20-somite zebrafish embryo, showing the expression of Dre-miR-15-P1/2a/b in neural crest derived cell populations. Scale bar: 250 μm. h Western blot for Snail1 and β-actin from E11.5 control and Prrx1 mutant embryos, including quantification of intensity of Snail1 signal (n = 5 WT, 4 KO). i Snail1 IF in the nasal pit regions of E11.5 WT and mutant embryos. Scale bar: 250 μm for NP sections and 100 μm for insets (boxes 1 and 2). MRE miRNA responsive element, LNA locked nucleic acid, WT wild type, Mut mutant, NT neural tube, NP nasal pit. Quantifications are performed for one section of WT or mutant embryos, and the increase and expansion is observed in n = 2/2 mutant embryos compared to n = 3/3 different E11.5 WT. Bars represent mean plus SEM, indicated (n) represent number of independent experiments as biological replicates and asterisks indicate significant p value in t test for a, c, e, h and one-way ANOVA with Bonferroni’s multiple comparison test for (b), (d) (*p < 0.05, **p < 0.01 and ***p < 0.001). Source data are provided as a Source Data file

Acknowledgments
This image is the copyrighted work of the attributed author or publisher, and ZFIN has permission only to display this image to its users. Additional permissions should be obtained from the applicable author or publisher of the image. Full text @ Nat. Commun.