
|
Fig. S5
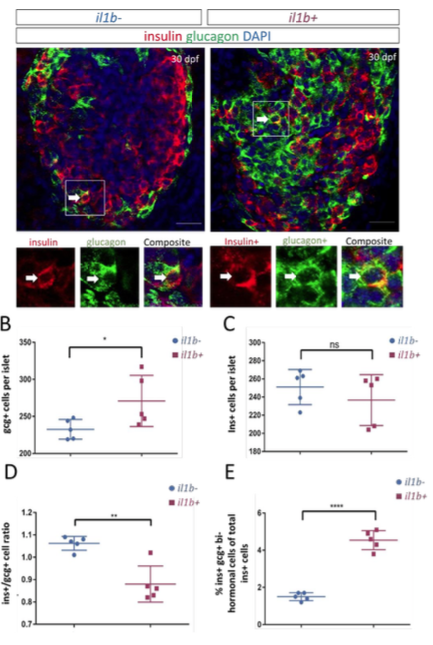
Tg(ins:il1b) juveniles exhibit an increase in alpha-cells and higher proportion of insulin-positive cells that co-express glucagon.
(A) Confocal slices (single plane) showing the primary islets in 30 dpf WT and Tg(ins:il1b) juveniles. The higher-magnification insets show insulin/glucagon double-positive cells corresponding to the outlined region in the top panels (arrows). (B) Quantification of the number of glucagon-positive cells per islet. Tg(ins:il1b) animals exhibit an increase in glucagon-positive cells. Unpaired two-tailed t-test with Welch’s correction; *p-value ≤ 0.05, mean±SD. (C) Quantification of the number of insulin-positive cells per islet. Unpaired two-tailed t-test with Welch’s correction, ns: not significant. mean±SD. (D) Quantification of the ratio of insulin-to-glucagon-positive cells per islet. Unpaired two-tailed t-test with Welch’s correction; **p-value ≤ 0.01, mean±SD. (E) Quantification of portion of insulin positive cells per that co-express glucagon over the total number of insulin-positive cells per islet. Unpaired two-tailed t-test with Welch’s correction; ****p-value ≤ 0.0001, mean±SD. Scale barsin A = 20 μm.