
|
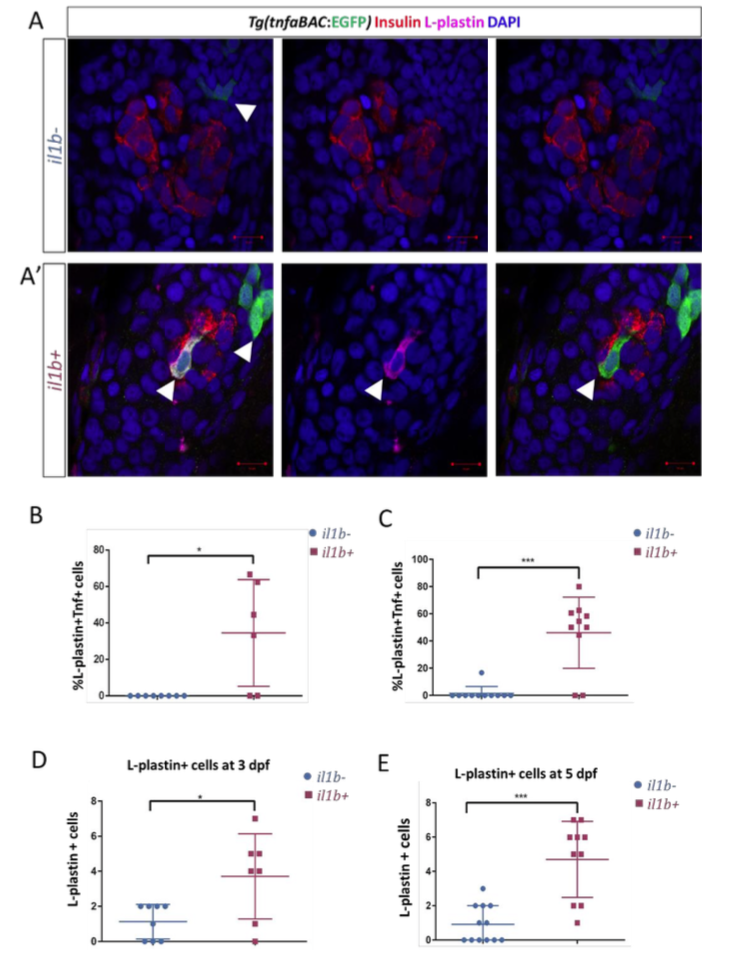
Fig. S1
Leukocytes express tnfa in Tg(ins:il1b) larvae.
(A-A’) Confocal slices (single plane) showing the primary islets of 3 dpf WT (A) and Tg(ins:il1b) larvae (A’) in the background of a Tg(tnfa:GFP) transcriptional reporter. The arrow in A’ shows an L-plastin-positive cell (magenta), which is also positive for tnfa:GFP (green). This cell is embedded in the islet. Some GFP-positive cells can be observed in the region corresponding to the extra-pancreatic duct in both WT and Tg(ins:il1b) larvae. These cells are L-plastin-negative. (B-C) Quantification of the proportion of GFP-positive cells among the L-plastin-positive cells in contact with the islet at 3 (B), unpaired two-tailed t-test with Welch’s correction, *p-value ≤ 0.05, mean±SD and 5 dpf (C), unpaired two-tailed t-test with Welch’s sorrection, ***p-value ≤ 0.001, mean±SD. (D-E) Quantification of the total number of L-plastin cells in contact with the islet at 3 (D), unpaired two-tailed t-test with Welch’s correction, *p-value ≤ 0.05, mean±SD and 5 dpf (E), unpaired two-tailed t-test with Welch’s correction, ***p-value ≤ 0.001, mean±SD . Scale bars in A-A’= 10 μm.