
Image
|
Figure Caption
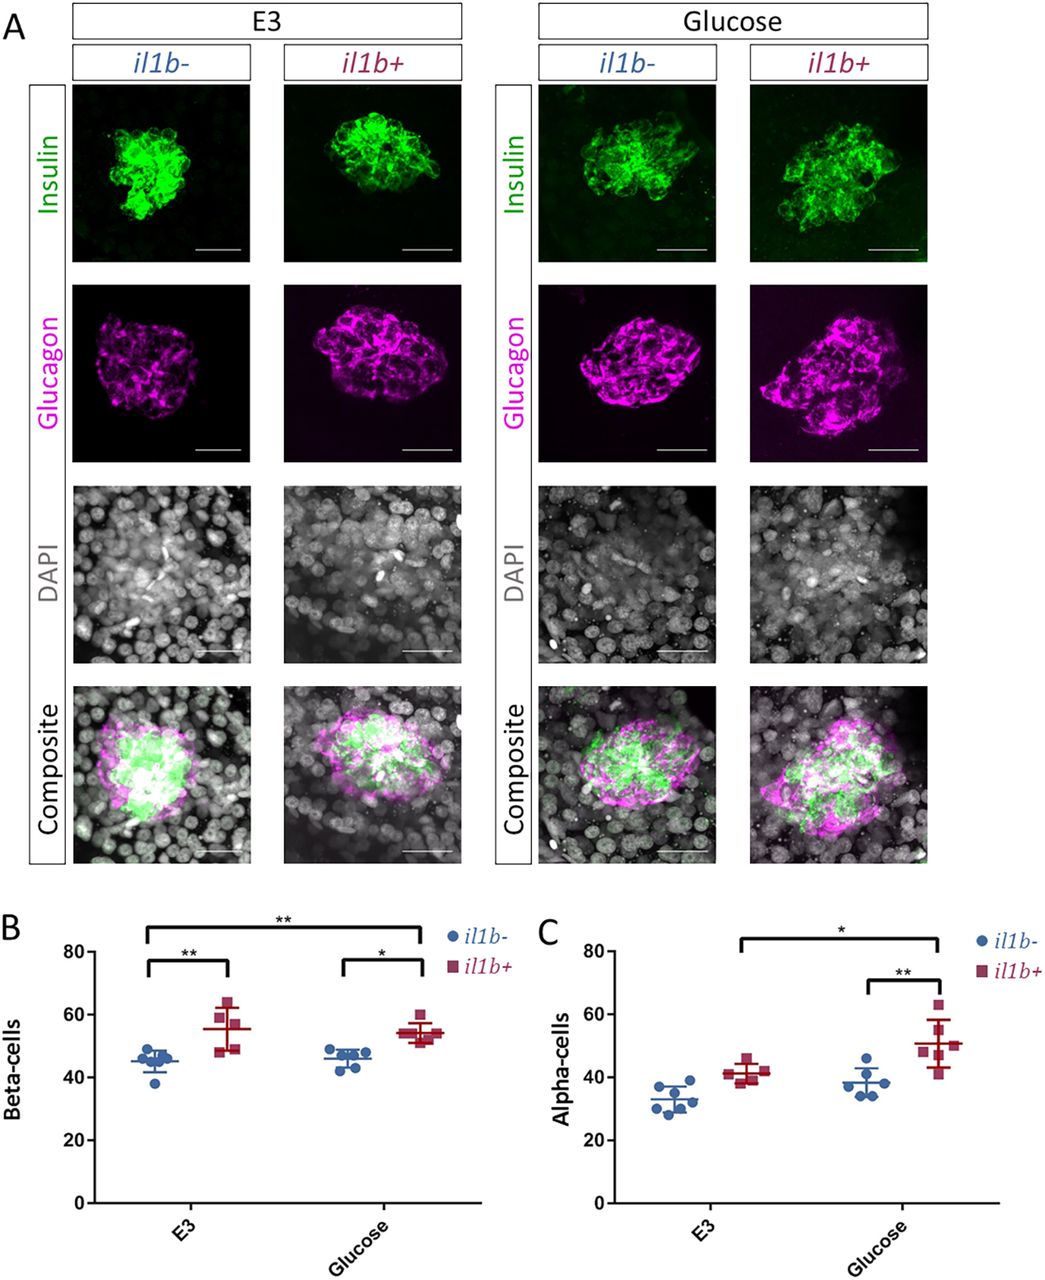
Fig. 5
Chronic inflammation and high-glucose exposure leads to α-cell expansion. (A) Confocal images (maximum projections) of islets from WT and Tg(ins:il1b) larvae at 5 dpf following incubation in either E3 or 130 mM glucose from 3 to 5 dpf. Immunostainings against insulin (green) and glucagon (magenta) mark the β-cells and the α-cells, respectively. (B) Quantification of the number of β-cells in WT and Tg(ins:il1b) larvae. Tg(ins:il1b) larvae exhibit an increase in β-cells in both E3 and glucose. Two-way ANOVA with Sidak's multiple-comparison test; *P≤0.05, **P≤0.01. Mean±s.d. (C) Quantification of the number of α-cells in WT and Tg(ins:il1b) larvae. The number of α-cells did not differ significantly (P<0.5) between WT and Tg(ins:il1b) in E3. However, there were significantly more α-cells in Tg(ins:il1b) larvae compared to WT in the glucose-treated group. Two-way ANOVA with Sidak's multiple-comparison test; *P≤0.05, **P≤0.01. Scale bars: 20 μm.
Figure Data
Acknowledgments
This image is the copyrighted work of the attributed author or publisher, and
ZFIN has permission only to display this image to its users.
Additional permissions should be obtained from the applicable author or publisher of the image.
Full text @ Dis. Model. Mech.