
Image
|
Figure Caption
Figure 5
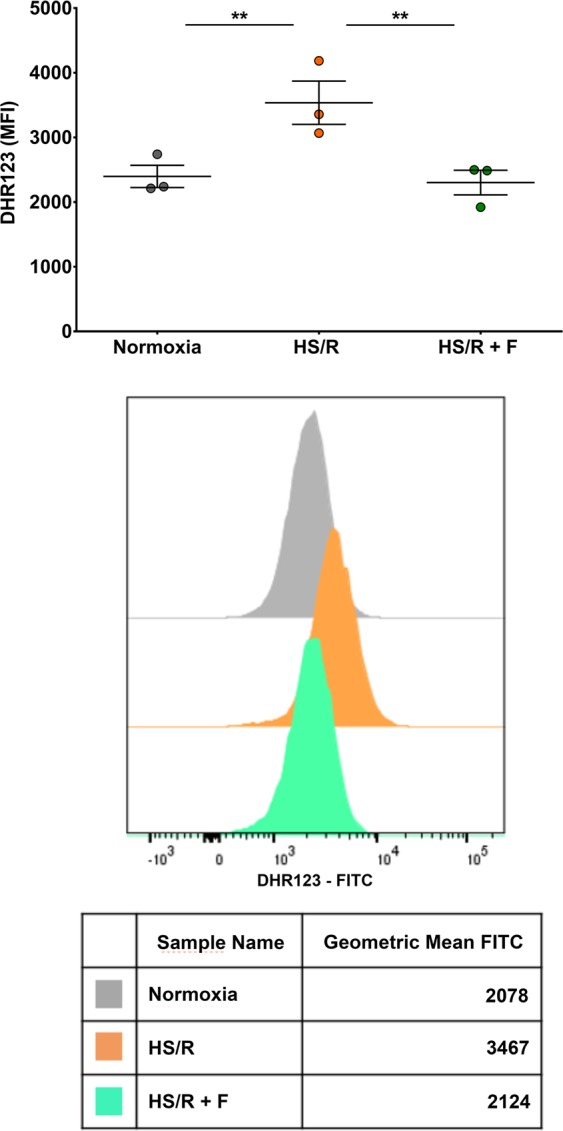
Fisetin decreased ROS expression level in cardiomyocytes. The cell permeable, nonfluorescent dihydrorhodamine 123 probe enters the cell where it is oxidized by ROS to fluorescent rhodamine 123. Fluorescence intensity, proportional to ROS expression level, was measured by flow cytometry in each experimental group. Normoxia: control group; HS/R: cells subjected to HS/R, treated with DMSO as vehicle control; HS/R + F: cells subjected to HS/R, treated with 15 μM fisetin. Results are expressed as the mean of three independent experiments. One-way ANOVA. Post-hoc analysis by Tukey. **P ≤ 0.01.
Acknowledgments
This image is the copyrighted work of the attributed author or publisher, and
ZFIN has permission only to display this image to its users.
Additional permissions should be obtained from the applicable author or publisher of the image.
Full text @ Sci. Rep.