
|
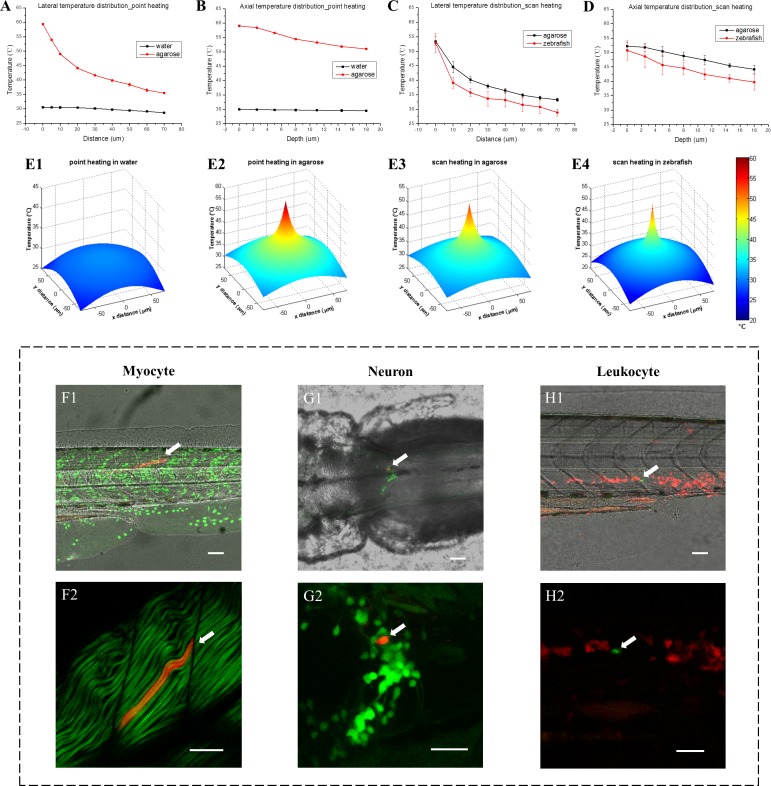
Figure 2
3D temperature distribution measured through fluorescent thermometry and single-cell gene induction in zebrafish.
(A) Lateral temperature distributions with IR laser heating in water and 3% agarose (95 mW IR laser was focused in samples for point heating). (B) Corresponding axial temperature distributions in water and 3% agarose. (C) Lateral temperature distributions with IR laser scan heating in 3% agarose and zebrafish muscle in vivo (95 mW IR laser was scanned in an 8 µm × 8 µm region during heating to avoid tissue injury). (D) Corresponding axial temperature distributions in 3% agarose and zebrafish muscle in vivo. Each statistical distribution curve in (A–D) is shown in terms of the mean with the standard deviation over more than five measurements. (E1–E4) 3D view of lateral temperature distributions with IR laser point and scan heating in water, 3% agarose and zebrafish muscle, respectively. (F1) A merged image of bright-field (gray) middle trunk, Dendra2-labeled nuclei (green) and a single myocyte expressing DsRedx via heat shock gene induction (red) in a one dpf zebrafish. (F2) A merged image of second harmonic generation (SHG) of muscle fibers (green) and the single myocyte expressing DsRedx (red). (G1) A merged image of bright-field (gray) hindbrain, GFP-labeled tyrosine hydroxylase-positive (th-positive) neurons (green) and a single neuron expressing DsRedx via heat shock gene induction (red) in a three dpf zebrafish. (G2) An enlarged image of (G1) with GFP and DsRedx-labeled neurons (by maximum projections). (H1) A merged image of bright-field (gray) middle trunk, DsRedx-labeled leukocytes (red) and a single cell expressing GFP via heat shock gene induction (green) in a two dpf zebrafish. (H2) An enlarged image of (H1) with merged DsRedx and GFP-labeled leukocytes. Arrows in (F–H): heat-shock labeled single myocyte, neuron and leukocyte, respectively. Scale bars: 50 µm (F1–H1); 30 µm (F2–H2).