
Image
|
Figure Caption
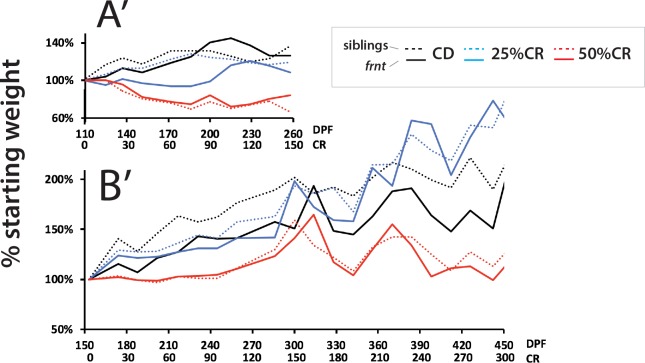
Figure 9—figure supplement 1.
Analysis of average weight per treatment group for both experiments (A’ and B’, respective to experimental results in
Acknowledgments
This image is the copyrighted work of the attributed author or publisher, and
ZFIN has permission only to display this image to its users.
Additional permissions should be obtained from the applicable author or publisher of the image.
Full text @ Elife