IMAGE

Figure 3

ID
ZDB-IMAGE-200213-28
Genes
Antibodies
Source
Figures for Gregson et al., 2019
Image
Figure Caption

Figure 3

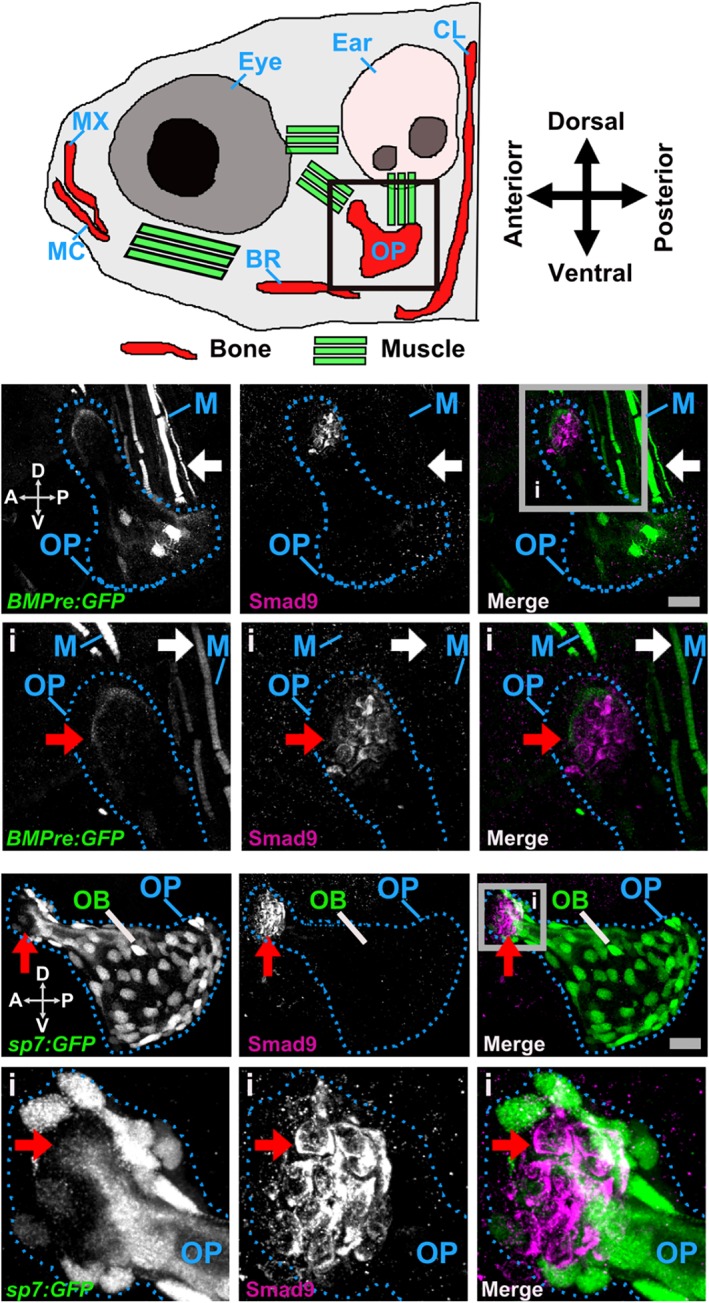
Smad9 protein expression in the larval zebrafish opercle bone. (A) Schematic of the larval zebrafish head (6 days post fertilization [dpf], lateral view), showing visible ossified elements (red) and the main muscle groups (green) that are green fluorescent protein (GFP)‐positive under control of the BMP‐responsive elements promoter (BMPre) transgenic reporter line (BMPre:GFP). The black box indicates the location of the intramembranous opercle bone as shown in B and C. (B) Distinct tissue distribution of Smad9‐ and BMP‐expressing cells (7 dpf). Upper left panel: BMPre:GFP‐positive cells (white) in the levator operculi muscle group (white arrow) and ventral (V) side of the opercle (OP; dotted blue outline); upper middle: distinct group of Smad9‐positive cells (white) in the dorsal (D) tip of the opercle; upper right: merged view showing distinct tissue expression of BMPre:GFP‐positive cells (green) and Smad9‐positive cells (purple); lower left: gray box inset (i) showing faint cap of BMPre:GFP‐positive cells at the dorsal tip of the opercle (red arrow); lower middle: cluster of Smad9‐positive cells; lower right: merged view confirming non‐overlapping distribution of BMPre:GFP‐positive cells and Smad9‐positive cells. Images from n = 4 larvae. (C) Distinct tissue distribution of Smad9‐ and osterix (Sp7)‐expressing cells (6 dpf). Upper left: Sp7:GFP‐positive osteoblasts (OB; white) within the opercle; upper middle: Smad9‐positive cells (white) in the antero (A)‐dorsal tip of the opercle (red arrow); upper right: merged view showing separation of Sp7:GFP‐positive cells (green) and Smad9‐positive cells (purple) (Supplemental Movie S1 in File S1); lower left: the inset (i, gray box) shows few Sp7:GFP‐positive osteoblasts within the dorsal tip of the opercle; lower middle: cluster of Smad9‐positive cells; lower right: merged view confirming non‐overlapping distribution of Sp7:GFP‐ and Smad9‐positive cells. Images from n = 6 larvae. (B, C) Scale bar = 20 μm; all are maximum‐intensity z‐projection confocal images. A = anterior; BR = branchiostegal ray; CL = cleithrum; D = dorsal; M = muscle; MC = Meckel's cartilage; MX = maxilla; OB = osteoblast; OP = operculum; P = posterior; V = ventral.

Figure Data
Acknowledgments
This image is the copyrighted work of the attributed author or publisher, and ZFIN has permission only to display this image to its users. Additional permissions should be obtained from the applicable author or publisher of the image. Full text @ J. Bone Miner. Res.