IMAGE

Fig. 6

ID
ZDB-IMAGE-200213-16
Source
Figures for Shibata-Germanos et al., 2019
Image
Figure Caption

Fig. 6

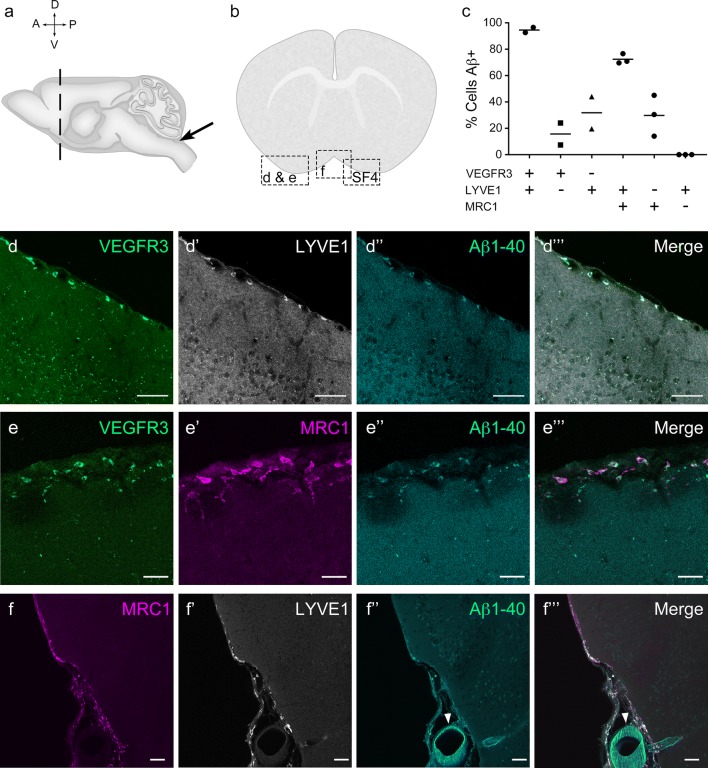
Mouse LLECs take up Aβ 1-40. a Schematic showing the site of dye and Aβ1-40 perfusion into the CSF via the cisterna magna (arrow) of a 2-month old mouse. The dotted line indicates the plane of section. A anterior, P posterior, D dorsal, V ventral. b Coronal brain section indicating the areas imaged. SF4 refers to area captured in Figure S4. c The percentage of each labelled cell type that internalized perfused Aβ. Cells co-expressing VEGFR3 and LYVE1 take up Aβ at a higher rate than MRC1, LYVE1 double-positive cells as well as MRC1-positive, LYVE1-negative cells (p ≤ 0.05, bootstrap). VEGFR3, LYVE1 counts, n = 2 brains (3 sections/brain). MRC1, LYVE1 counts, n = 3 brains (3 sections/brain). d–d′′′ Cells of the adult mouse meninges that co-express VEGFR3 (d, green) and LYVE1 (d′, white) internalize Aβ1-40 (d′′, cyan). Scale = 20 µm. e-e′′′) Cells of the adult mouse meninges that co-express VEGFR3 (e, green) and MRC1 (e′, white) internalize Aβ1-40 (e′′, cyan). Scale = 40 µm. ff′′′) Cells of the adult mouse meninges that co-express MRC1 (f, magenta) and LYVE1 (f′, white) internalize Aβ1-40 (f′′, cyan). The walls of a blood vessel (white arrowhead, f′′) also accumulate Aβ1-40. Scale = 60 µm

Acknowledgments
This image is the copyrighted work of the attributed author or publisher, and ZFIN has permission only to display this image to its users. Additional permissions should be obtained from the applicable author or publisher of the image. Full text @ Acta Neuropathol.