
Image
|
Figure Caption
FIGURE 2
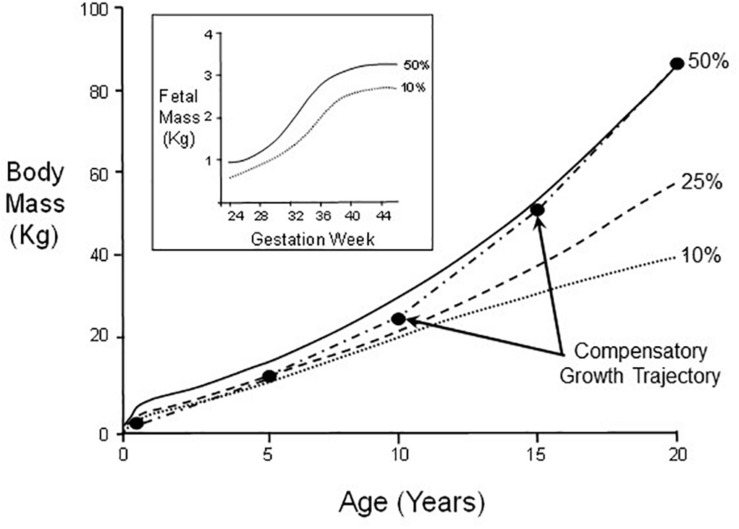
Body mass changes in male humans between birth and age 20. Indicated are growth curves for 50th, 25th, and 10th percentiles of the population. A hypothetical example of catch-up growth is also indicated. Inset: Fetal mass as a function of gestation week for 50th and 10th percentiles.
Acknowledgments
This image is the copyrighted work of the attributed author or publisher, and
ZFIN has permission only to display this image to its users.
Additional permissions should be obtained from the applicable author or publisher of the image.
Full text @ Front. Physiol.