IMAGE

Figure 1

ID
ZDB-IMAGE-200212-11
Source
Figures for Idigo et al., 2020
Image
Figure Caption

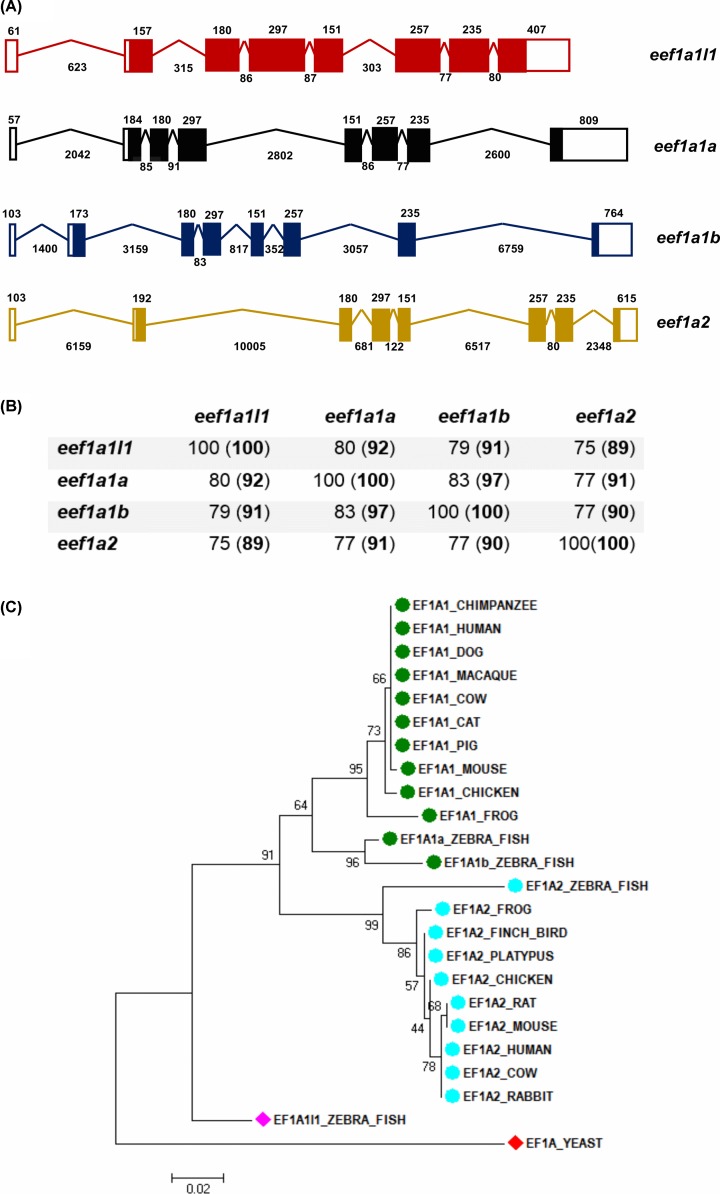
Figure 1 Four <italic>eef1a</italic> genes identified in the zebrafish genome

(A) Schematic representation of the exon–intron organisation of eef1a1l1 (red), eef1a1a (black), eef1a1b (blue) and eef1a2 (yellow) structures obtained from the Ensembl database. Length (in base pairs) of exons and introns, which are not drawn to scale, are indicated above and below respectively. (B) Percentage identity matrix for zebrafish Eef1as at the nucleotide and amino acid sequence level (in brackets) calculated using Clustal Omega. (C) Phylogenetic relationship among the zebrafish Eef1as and other vertebrate eEF1As using the maximum likelihood method.

Acknowledgments
This image is the copyrighted work of the attributed author or publisher, and ZFIN has permission only to display this image to its users. Additional permissions should be obtained from the applicable author or publisher of the image. Full text @ Biosci. Rep.