IMAGE

Figure 5

ID
ZDB-IMAGE-200210-37
Genes
Source
Figures for Zuccarini et al., 2019
Image
Figure Caption

Figure 5

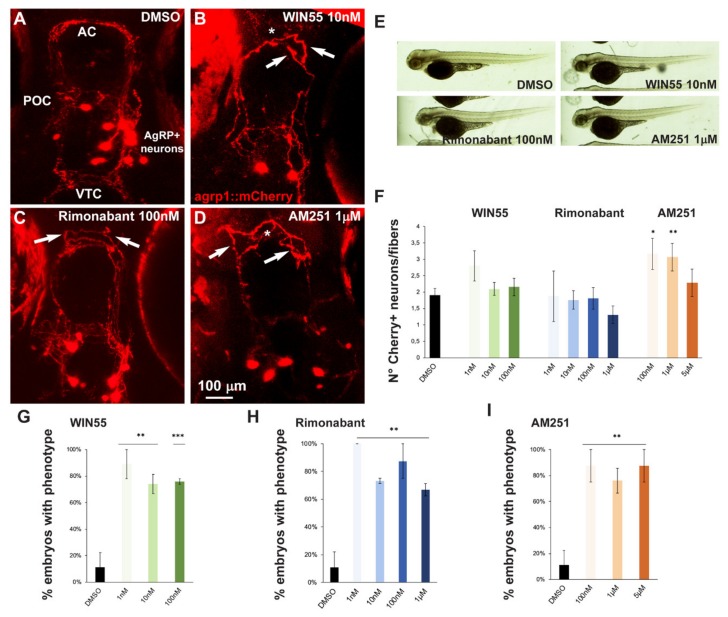
Effect of pharmacological manipulation of CB1R on AgRP1 neurons in zebrafish embryos. (A–D) Representative images of mCherry+ neurons and projections in the basal forebrain of embryos, at the age 96 hpf, treated with DMSO only as control (A), WIN55 (B), Rimonabant (C) or AM251 (D) at the indicated doses. The observation plane is the same as in Figure 2. Scale bar is reported in (D). White asterisks indicate altered fasciculation at the anterior commissure, and white arrows indicate misguided mCherry+ projections. (E) Bright-field, low-magnification images of whole fish embryos treated with DMSO only or with the indicated ligands. A normal general morphology and growth was observed. (F) Quantification of the ratio of mCherry+ neurons/mCherry+ fibers in embryos treated with DMSO only (solid black bar) or treated with WIN55, Rimonabant or AM251 at the indicated doses. Color code is the same as in Figure 1. Treatment with AM251 resulted in a higher neurons/fibers ratio. (G–I) Quantification of the misguidance and altered commissural phenotype, expressed as % of the number of embryos observed upon treatment with WIN55 (G), Rimonabant (H) or AM251 (I). Color code as in Figure 1. Data are expressed as means ± SEM from three independent experiments. * = p < 0.05; ** = p < 0.01; *** = p < 0.001. AC, anterior commissure; POC, postoptic commissure; VTC, ventral tegmental commissure.

Figure Data
Acknowledgments
This image is the copyrighted work of the attributed author or publisher, and ZFIN has permission only to display this image to its users. Additional permissions should be obtained from the applicable author or publisher of the image. Full text @ Int. J. Mol. Sci.