IMAGE

Figure 2

ID
ZDB-IMAGE-200210-34
Genes
Source
Figures for Zuccarini et al., 2019
Image
Figure Caption

Figure 2

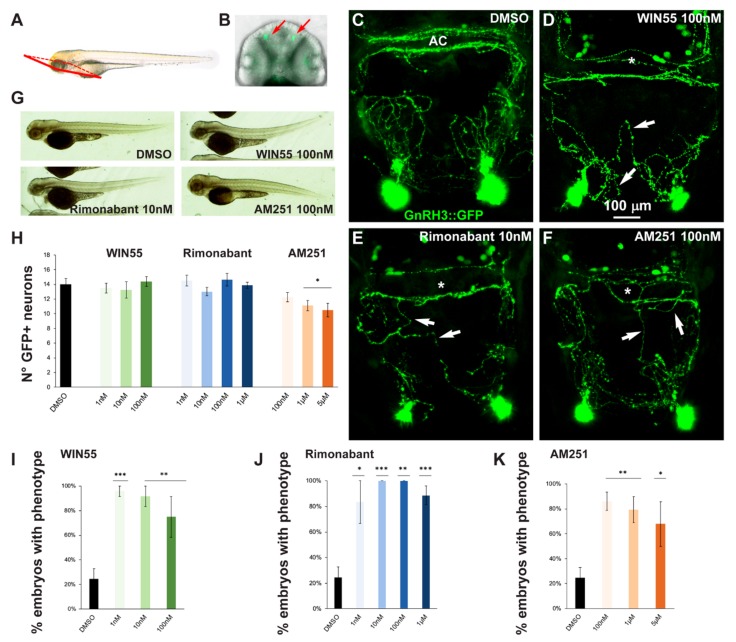
Pharmacological manipulation of CB1R on GnRH3 neurons in zebrafish embryos. (A) Scheme showing the observation plane used for the micrographs in (C–F). (B) Low magnification of the head piece of gnrh3::EGFP embryos, viewed in combined fluorescence and bright field illumination. Red arrows indicate the EGFP+ cells associated to the terminal nerve. (CF) Representative images of EGFP+ neurons and their projections present in the nasal and basal forebrain regions of embryos at 72 hpf, treated either with DMSO only (negative control; C), with WIN55 (D), Rimonabant (E) or AM251 (F), at the indicated doses. Scale bar is reported in D. White arrows indicate misguided EGFP+ projections, and white asterisks indicate altered organization of EGFP+ fibers at the anterior commissure. (G) Bright-field low magnification images of whole embryos treated with DMSO only, WIN55, Rimonabant or AM251, showing a normal general morphology and growth. (H) Quantification of the number of EGFP+ neurons in the nasal region of fish embryos treated with DMSO only (black bar), or with WIN55, Rimonabant or AM251 at the indicated doses. The color code is the same as in Figure 1. No significant difference in the number of EGFP+ neurons was observed following these treatments. (I–K) Quantification of the misguidance and altered commissural phenotypes, expressed as % of the number of embryos presenting the phenotype, upon treatment with WIN55 (I), Rimonabant (J) or AM251 (K). Color code as in Figure 1. Data are expressed as means ± SEM from three independent experiments. * = p < 0.05; ** = p < 0.01; *** = p < 0.001. AC, anterior commissure.

Figure Data
Acknowledgments
This image is the copyrighted work of the attributed author or publisher, and ZFIN has permission only to display this image to its users. Additional permissions should be obtained from the applicable author or publisher of the image. Full text @ Int. J. Mol. Sci.