IMAGE

Figure 5.

ID
ZDB-IMAGE-200210-22
Source
Figures for Chhabria et al., 2018
Image
Figure Caption

Figure 5.

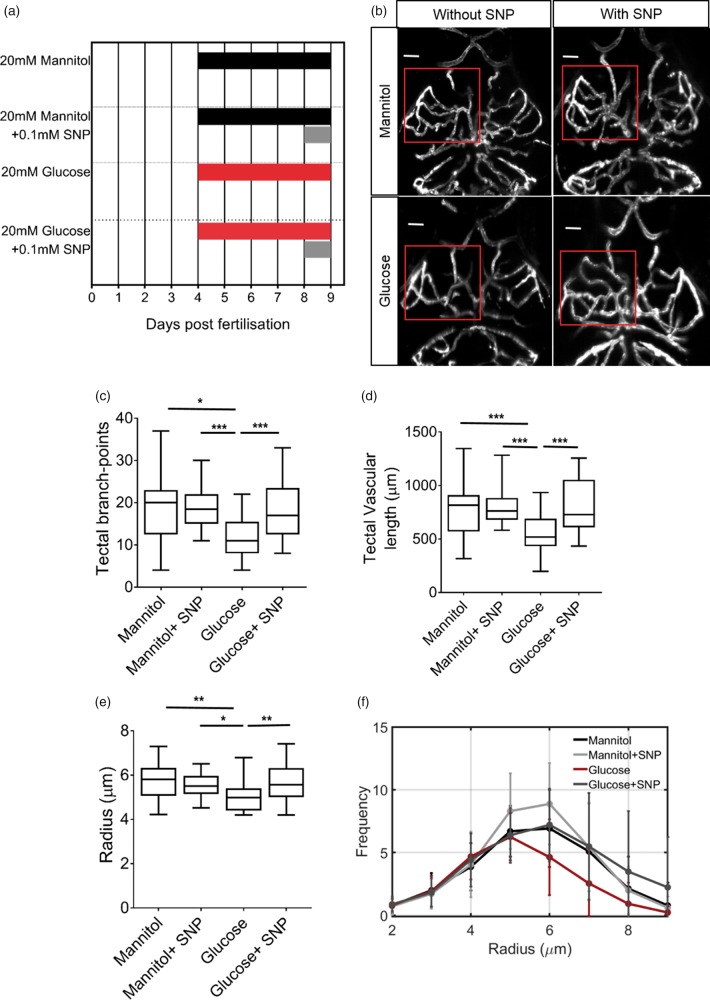
Sodium nitroprusside reverses the effect of glucose exposure on cerebrovascular patterning. (a) Gannt chart indicating treatment groups and duration of drugs exposures for experiments in Figures 6 and 7. (b) Representative micrographs of cerebral vessels of 9 dpf Tg(kdrl:mCherry) larvae exposed to mannitol or glucose ± SNP. (c) Quantification of number of tectal vascular branch points in all groups (n = 23 larvae/group). (d) Quantification of total tectal vessel length in same animals as in (c). (e) Mean tectal vessel radius for the same animals as in (c) (n = 23 larvae/group). (f) Histogram of radii of vessels in the left optic tectum in the same animals as in (c). Scale bar represents 20 µm. *p < 0.05, **p < 0.01, ***p < 0.005. Scale bar represents 20 µm. Data in (f) are mean ± s.d.

Figure Data
Acknowledgments
This image is the copyrighted work of the attributed author or publisher, and ZFIN has permission only to display this image to its users. Additional permissions should be obtained from the applicable author or publisher of the image. Full text @ J. Cereb. Blood Flow Metab.