IMAGE

Figure 4.

ID
ZDB-IMAGE-200210-21
Source
Figures for Chhabria et al., 2018
Image
Figure Caption

Figure 4.

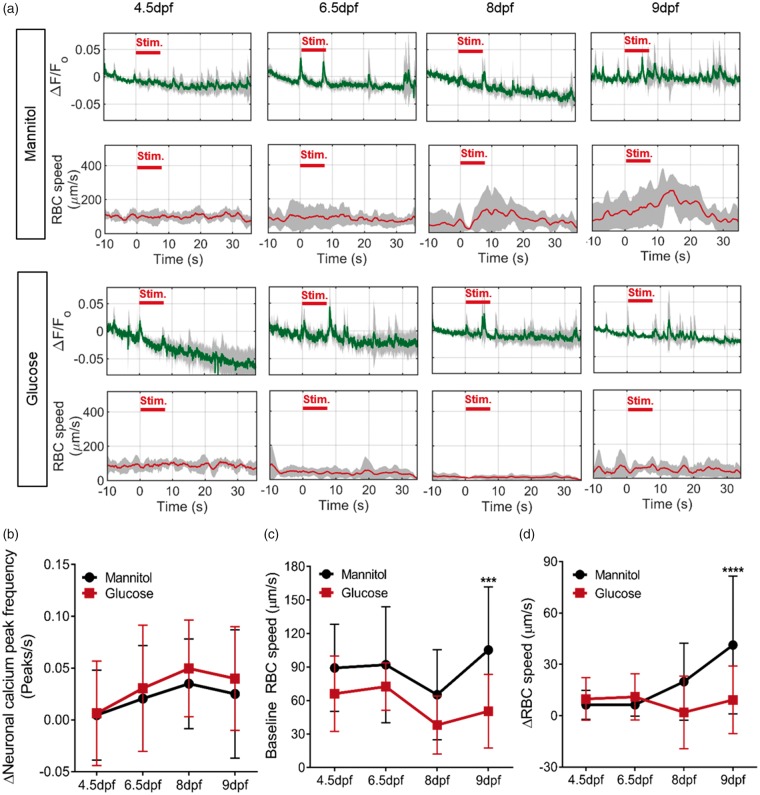
Effect of glucose exposure on neurovascular function in zebrafish. (a) Time series of neuronal activation (ΔF/Fo) and tectal vessel RBC speed in zebrafish exposed to 20 mM mannitol or glucose from 4 dpf for 12 h, 60 h, 96 h and 120 h (n = 5 larvae/group). (b) Change in neuronal calcium peak frequency in the left optic tectum during response compared to baseline periods (n = 17, 17, 15 and 20 for 12 h, 60 h, 96 h and 120 h exposure, respectively). (c) Baseline RBC speed at the same time points in (b) and (c). (d) Change in RBC speed (ΔRBC) between baseline and response time periods for the same animals as (b). ***p < 0.005, ****p < 0.0001. Data are mean ± s.d.

Figure Data
Acknowledgments
This image is the copyrighted work of the attributed author or publisher, and ZFIN has permission only to display this image to its users. Additional permissions should be obtained from the applicable author or publisher of the image. Full text @ J. Cereb. Blood Flow Metab.