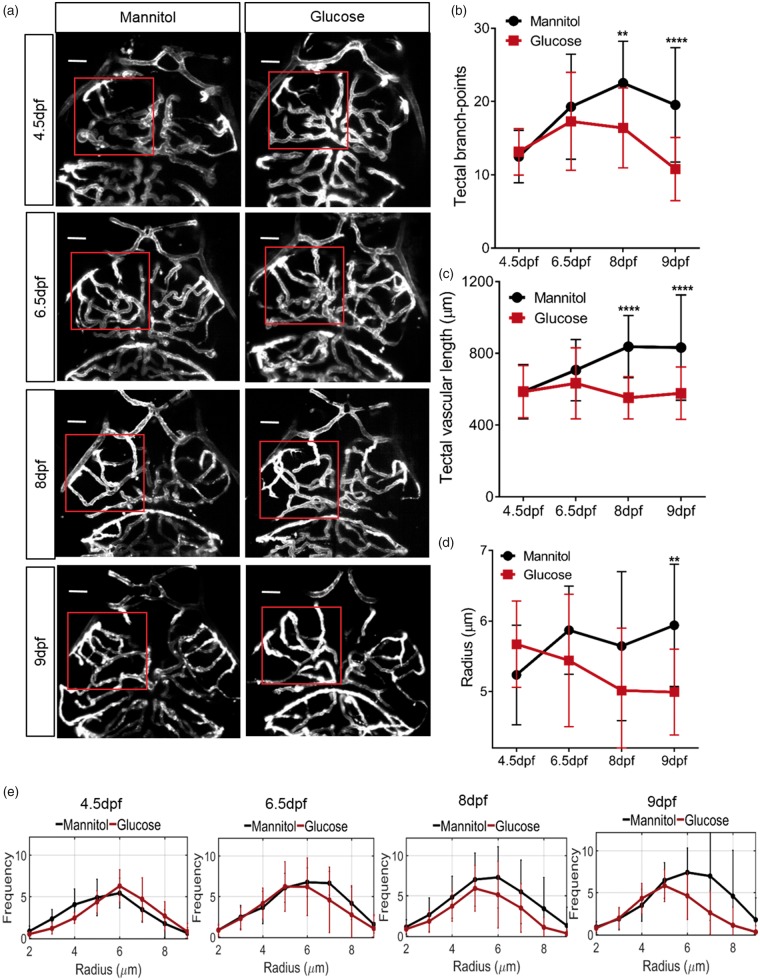
IMAGE

Figure 3.

ID
ZDB-IMAGE-200210-20
Source
Figures for Chhabria et al., 2018
Image
Figure Caption

Figure 3.

Effect of glucose exposure on cerebrovascular patterning in zebrafish. (a) Representative micrographs of cerebral vessels exposed to 20 mM mannitol or glucose from 4 dpf for 12 h, 60 h, 96 h and 120 h. Square indicates region of left optic tectum quantified in (b)–(e). (b) Number of tectal vessel branchpoints (n = 17, 16, 15 and 20 larvae for 12 h, 60 h, 96 h and 120 h exposure, respectively). (c) Total tectal vessel length in same animals as (b). (d) Mean tectal vessel radius in same animals as in (b). (e) Histograms of tectal vessel radii of tectal vessels in same animals as in (b). Scale bar represents 20 µm. Data are mean ± s.d.

Figure Data
Acknowledgments
This image is the copyrighted work of the attributed author or publisher, and ZFIN has permission only to display this image to its users. Additional permissions should be obtained from the applicable author or publisher of the image. Full text @ J. Cereb. Blood Flow Metab.