
Figure 6
- ID
- ZDB-IMAGE-200208-4
- Publication
- Honkoop et al., 2019 - Single-cell analysis uncovers that metabolic reprogramming by ErbB2 signaling is essential for cardiomyocyte proliferation in the regenerating heart
- All Figures
- Figures for Honkoop et al., 2019
|
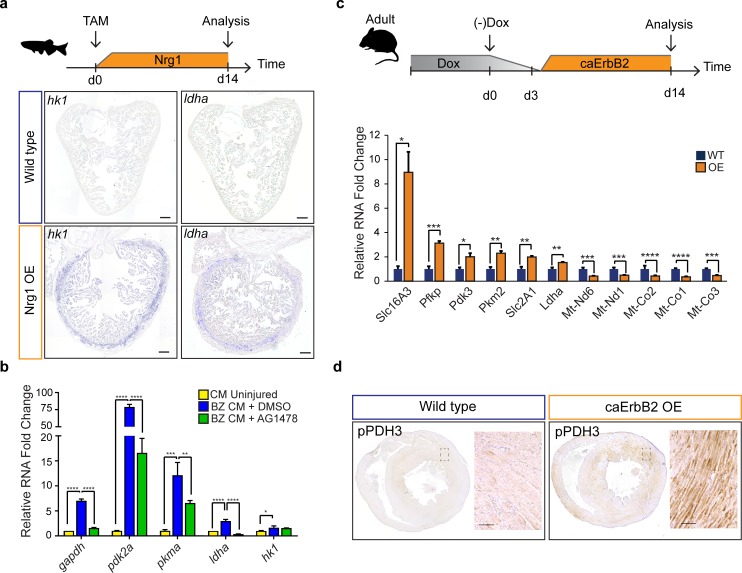
Figure 6 Nrg1/ErbB2 signaling induces glycolysis genes in zebrafish and mouse. (a) Cartoon showing experimental procedure to induce cardiomyocyte specific Nrg1 expression in zebrafish. Panels show in situ hybridization for hexokinase 1 (hk1) and lactate dehydrogenase a (ldha) expression on sections of control hearts (β-act2:BSNrg1) and Nrg1 OE hearts (cmlc2:CreER; β-act2:BSNrg1). Scale bars represent 100 μm. (b) qPCR results for glycolytic genes showing their relative fold change in DMSO treated (n = 9) (blue) and AG1478 treated (n = 9) (green) nppa:mCitrine high border zone cardiomyocytes at 3dpi compared to uninjured adult cardiomyocytes (n = 4) (yellow). Error bars represent standard deviation. (c) Upper panel: Cartoon showing the experimental procedure to analyse metabolic gene expression after activating ErbB2 signaling in the murine heart. Lower panel: qPCR results for metabolic genes showing their relative fold change in caErbB2 OE (n = 4) heart compared to control WT hearts (n = 4). Error bars represent standard deviation. (d) Immunohistochemistry for phospho-PDH3 on sections of control and caErbB2 OE hearts. Scale bars represent 100 μm. *=p < 0.05, **=p < 0.01, ***=p < 0.001, ****=p < 0.0001.