
Figure 4—figure supplement 1.
- ID
- ZDB-IMAGE-200208-29
- Publication
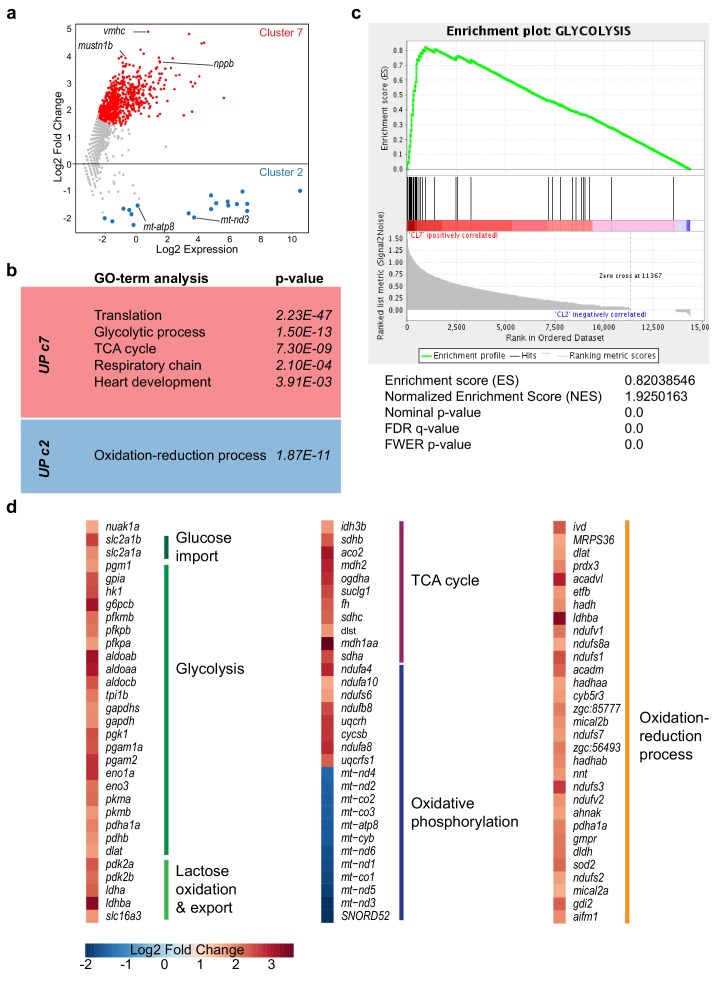
- Honkoop et al., 2019 - Single-cell analysis uncovers that metabolic reprogramming by ErbB2 signaling is essential for cardiomyocyte proliferation in the regenerating heart
- All Figures
- Figures for Honkoop et al., 2019
|
Figure 4—figure supplement 1.
(