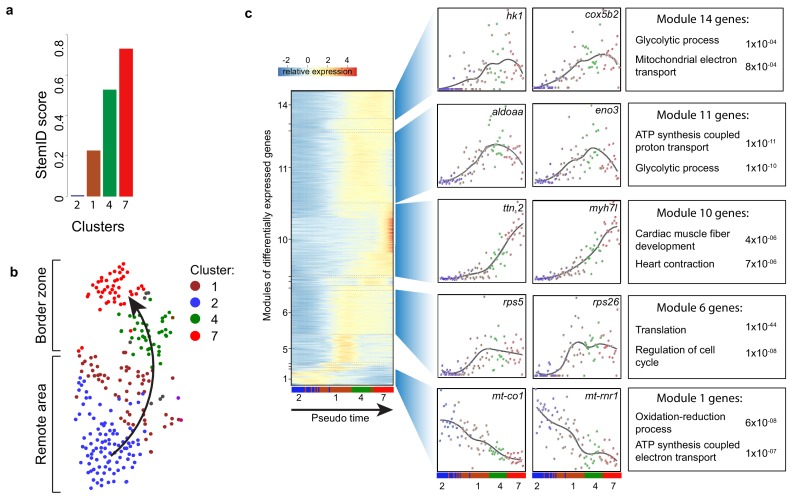
Figure 3 (a) Bar plot of StemID scores for the cardiomyocyte clusters (clusters #2, 1, 4 and 7) calculated by the formula: number of significant links for each cluster multiplied by the median transcriptome entropy across all cells in a cluster. (b) Cardiomyocyte clusters from adult injured heart. Arrow indicates the dedifferentiation path derived from the StemID scores. (c) Pseudo time analysis. Left; one-dimensional SOM of z-score transformed expression profiles along the differentiation trajectory incurred by StemID analysis. Y-axis represents the fourteen modules with differentially expressed genes. X-axis represents the pseudo time in which the cells were ordered. Middle; expression profiles of representative genes of the major modules. Y-axis shows transcript counts. X-axis represents the pseudo time. Right; Major gene ontology terms derived from all genes expressed in the module with p-values.
Image
Figure Caption
Acknowledgments
This image is the copyrighted work of the attributed author or publisher, and
ZFIN has permission only to display this image to its users.
Additional permissions should be obtained from the applicable author or publisher of the image.
Full text @ Elife

