
|
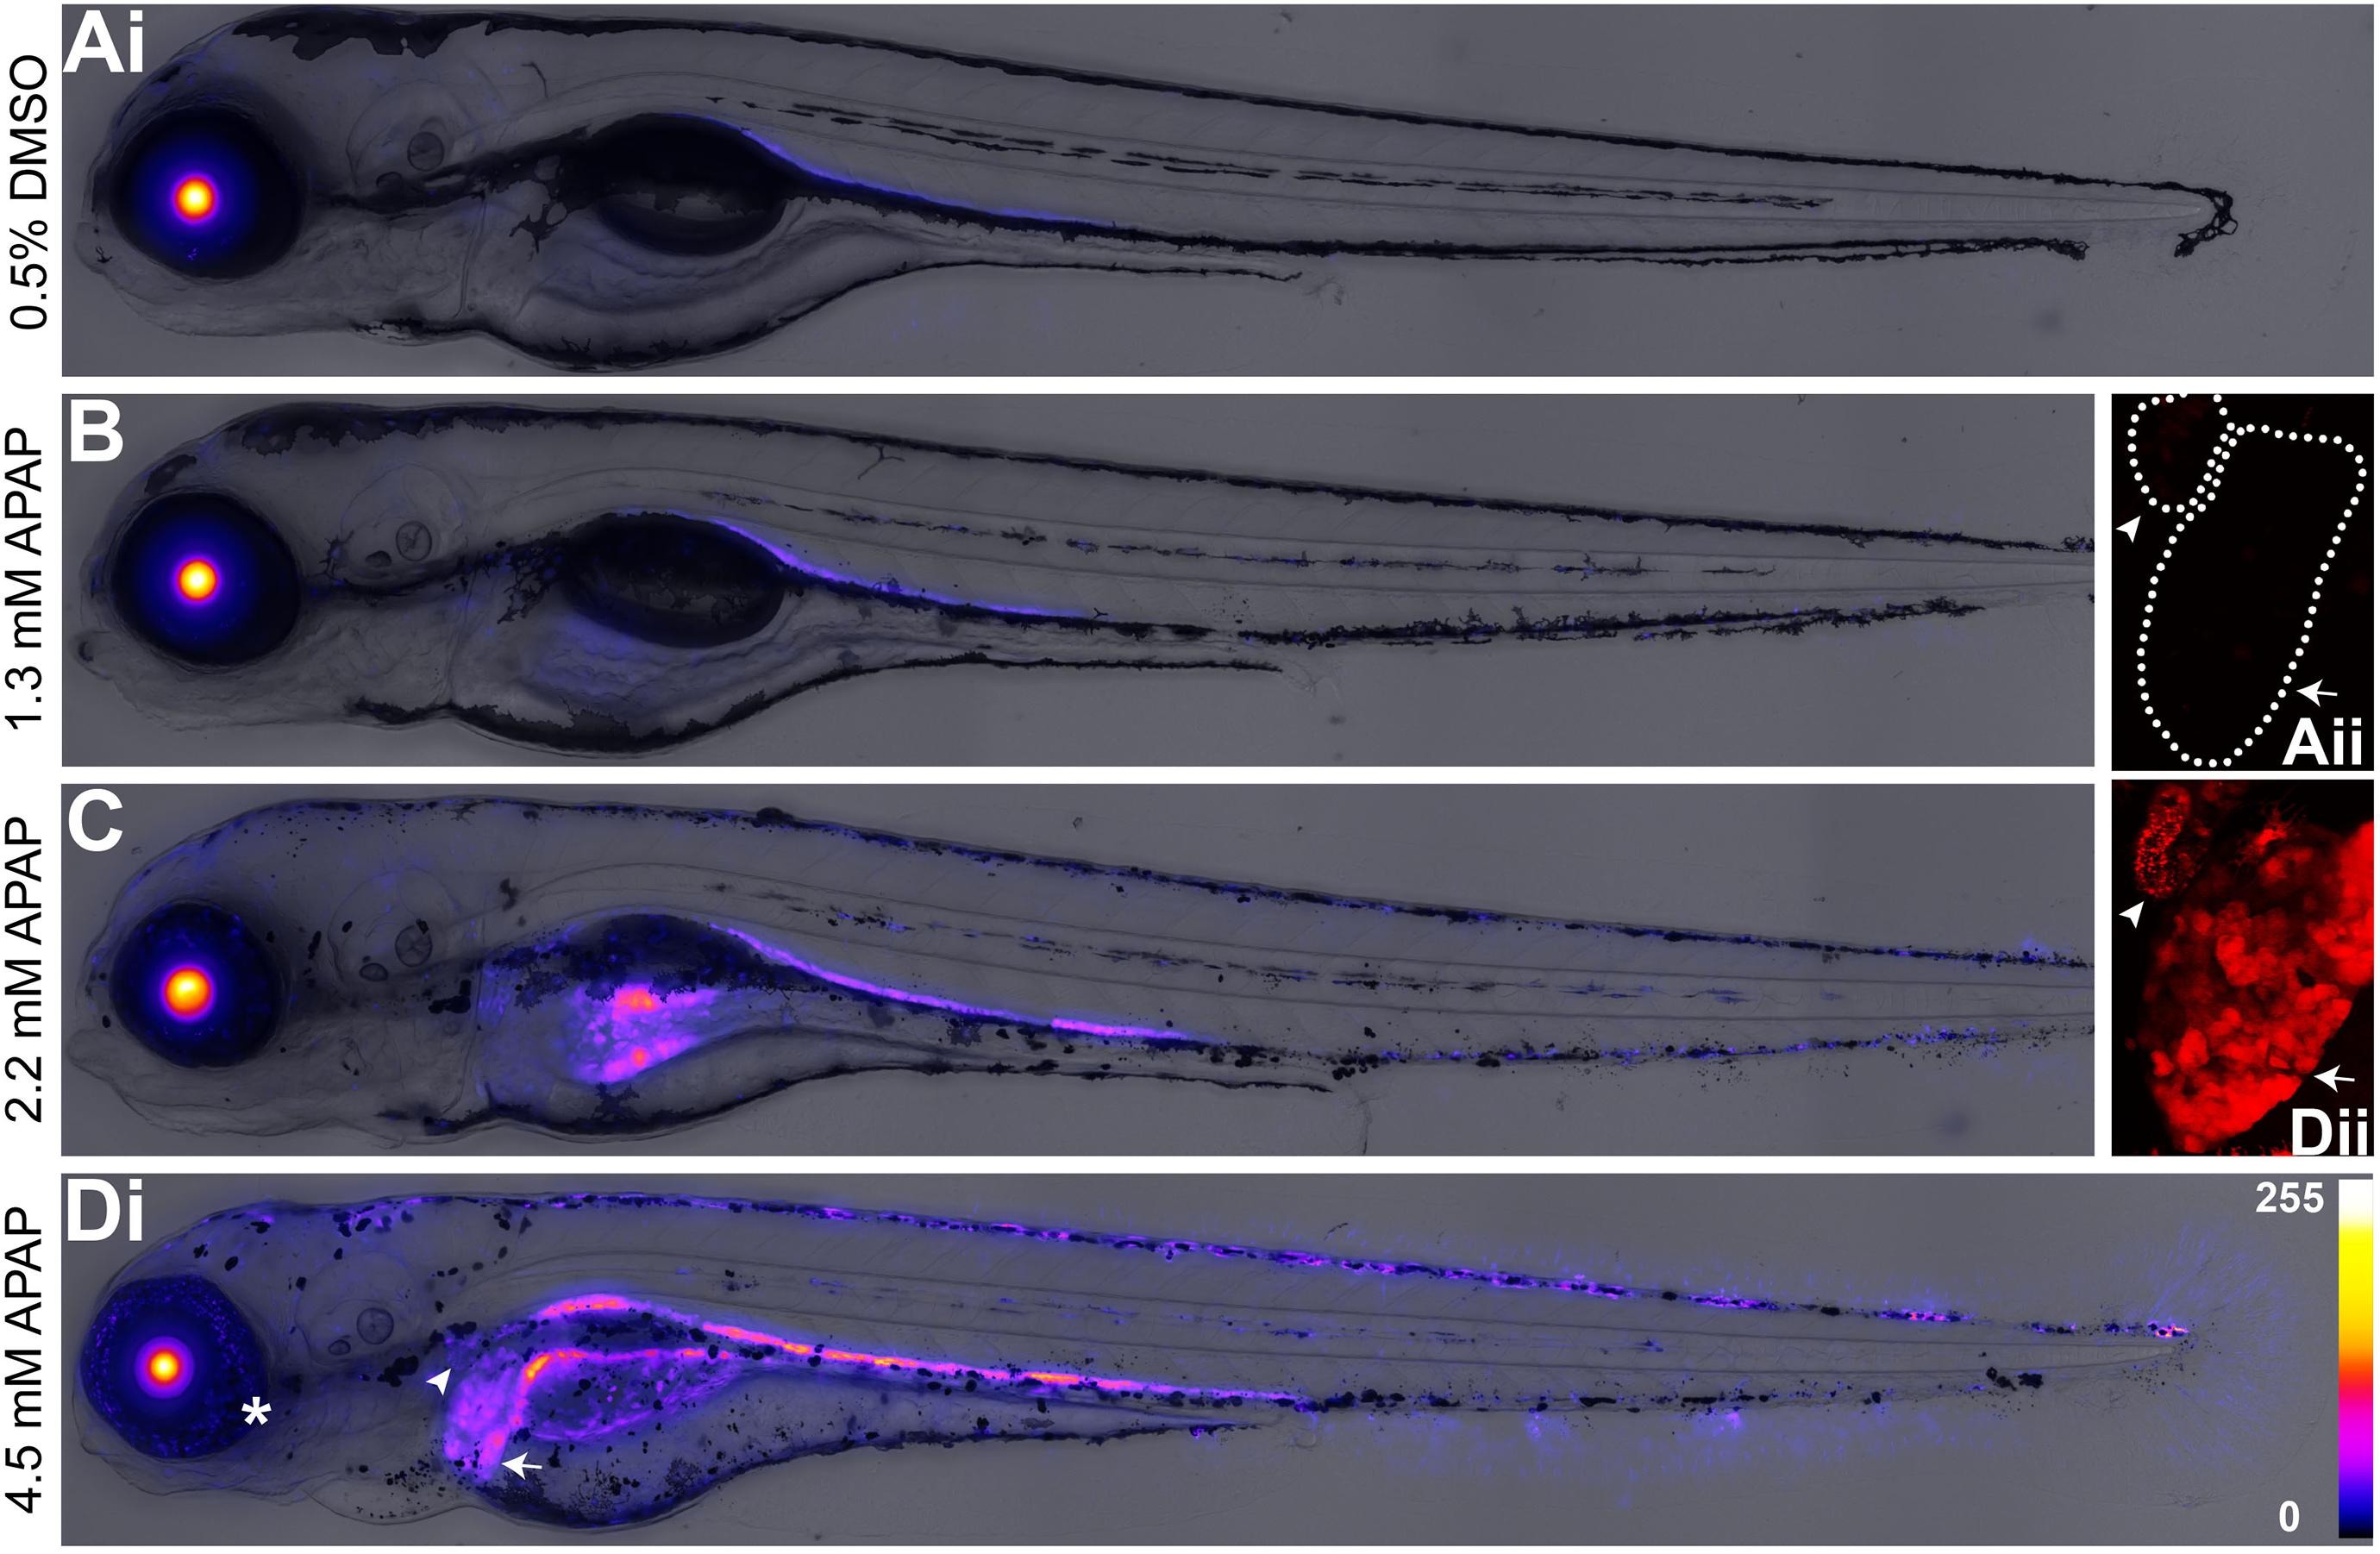
Fig. 3
Concentration-dependent tissue responses in Tg (3EpRE:hsp70:mCherry) zebrafish larvae exposed to acetaminophen (APAP). Fish larvae were exposed to a solvent control (Ai, ii) and three concentrations of APAP (B; C; Di, ii) from 2 to 4 dpf and subsequently imaged via epifluorescence and confocal microscopy. Confocal images illustrate a pronephric convoluted tubule and the liver under control (Aii) and 4.5 mM APAP (Dii) conditions. Arrowheads = pronephric convoluted tubule; arrows = liver; asterisk = retina. For images A–D, fluorescence intensity is represented using a “Fire” lookup table with a 0–255 pixel intensity calibration bar. Measured APAP culture medium concentrations displayed.