IMAGE

Fig. 4

ID
ZDB-IMAGE-200205-22
Source
Figures for Simões et al., 2020
Image
Figure Caption

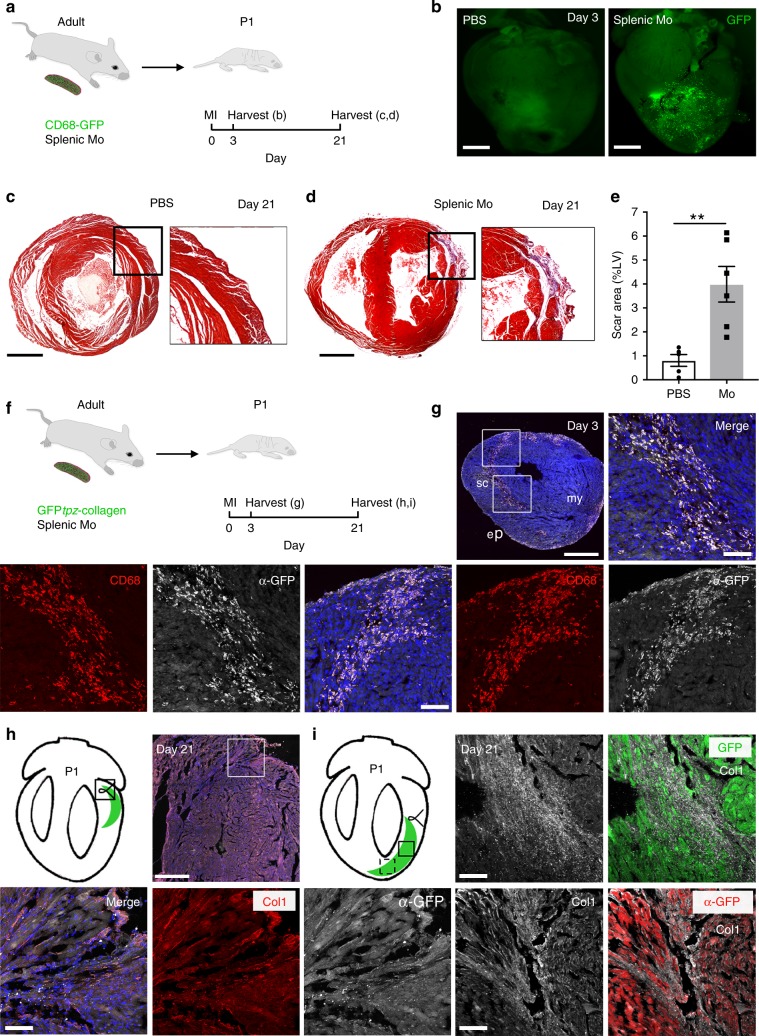
Fig. 4 Adult monocytes disrupt regeneration of P1 mouse heart and deposit collagen within a post-MI scar.

a Adult splenic monocytes from hCD68-GFP+ donors were transferred by intracardiac injection at time of MI surgery (50 ± 10 × 103 cells). P1 neonates were then harvested at day 3 (for imaging) or day 21 (for histology). b GFP Fluorescence imaging demonstrating adoptively transferred GFP+ monocytes were present in the anterior wall of the recipient P1 at day 3 post-MI (scale bar: 1 mm). c Masson’s trichrome staining of heart sections showing that at day 21 post-MI, P1 neonates which received PBS vehicle showed histological evidence of regeneration. d P1 neonates which received adult monocytes show residual scar formation. Scale bar: 1 mm. e Adoptive transfer of adult monocytes led to a significant increase in scar size at 21 days, measured as percentage of the left ventricular area (scar percentage 3.99 ± 0.74% vs 0.81 ± 0.25%, n = 5 in PBS group, n = 6 in monocyte group, **p< 0.01, data are mean ± SEM, 2-tailed, unpaired Student’s t-test). f Splenic monocytes transferred from adult GFPtpz-collagen mice to P1 recipients undergoing MI. g Confocal imaging of immunofluorescence-stained heart cryosections at day 3 post-MI revealed emergent GFP+ fibres within the scar region and a subset of α-CD68+ macrophages co-labelled for GFP indicating that they had arisen from donor monocytes and had activated the GFPtpz-collagen 1. Scale bars, 500 μm (low power panel), 100 μm (high power panels). h, i By day 21 post-MI, recipient P1 mice revealed GFP+ scars within the non-regenerated myocardium (schematised hearts; black inset boxes relate to immuno-stained regions in the vicinity of the ligating suture) (h) or within the injury area (top two panels in i; black dashed inset box relates to injury region depicted in bottom two panels in i). Both GFP fluorescence and α-GFP staining revealed evidence of donor-monocyte-derived GFP+ collagen fibrils which were Col1+ within the scar at day 21 post-MI. Scale bars, 500 μm (low power panel), 100 μm (high power panels). ep, epicardium; my, myocardium; P1, post-natal day 1; sc, scar. Representative images of n = 3 per group. Source data are provided as a Source Data file.

Acknowledgments
This image is the copyrighted work of the attributed author or publisher, and ZFIN has permission only to display this image to its users. Additional permissions should be obtained from the applicable author or publisher of the image. Full text @ Nat. Commun.