IMAGE

Fig. 2

ID
ZDB-IMAGE-200205-20
Source
Figures for Simões et al., 2020
Image
Figure Caption

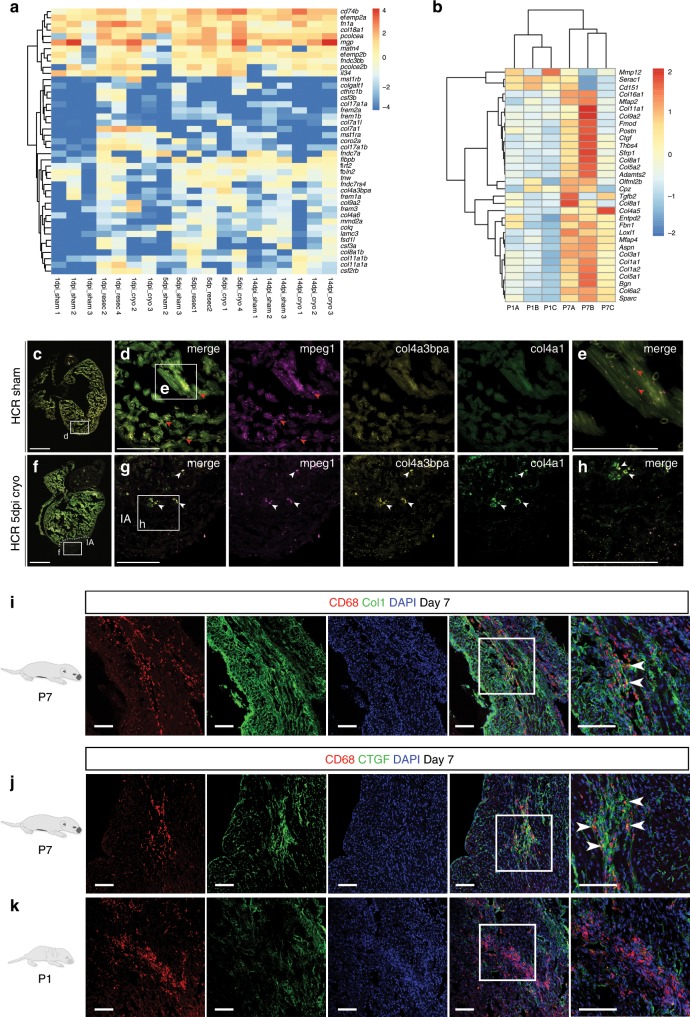
Fig. 2 ECM proteins are expressed by macrophages during heart regeneration and scar formation.

a Heatmap shows the log10 (normalised counts +0.01) of differentially expressed transcripts for extracellular matrix (ECM) components. Red—high expression. Yellow—medium expression. Blue—low expression. b Heatmap showing expression of ECM components in the regenerating P1 and scar-forming P7 mouse at day 7. ECM genes for comparison were identified from those expressed by adult mouse macrophages during the reparative phase of post-MI (temporal profile Fig. 1k) which also linked to the Proteinaceous Extracellular Matrix GO term. Red—high expression. Yellow—medium expression. Blue—low expression. ch HCR confocal imaging of simultaneous mpeg1 (fuchsia), col4a3bpa (yellow) and col4a1 (green) mRNAs patterns in the heart. Higher abundance of col4a3bpa and col4a1 transcripts in macrophages (white arrowheads) present in the 5 days post cryoinjury heart (f, injured area shown by dotted line, white boxes enlarged in g, h for detail), when compared to sham-operated hearts (c, white boxes enlarged in d, e for detail). Red arrowheads point to macrophages in the sham-operated heart. Scale bar: 200 μm (insets showing high-magnification images, scale bar: 100 μm). dpi: days post injury. IA: injured area. Representative images of n = 3 per group. i Confocal imaging of immunofluorescence-stained heart cryosections at day 7 post-MI from P7 mice, showing CD68+ macrophages (red) in close colocalisation with collagen I (Col1, green) fibrils in the process of scar formation (representative images of n = 3, scale bar: 100 μm). j, k Confocal imaging of immunofluorescence-stained heart cryosections at day 7 post-MI from P1 and P7 mice, showing CD68+ macrophages (red) and Connective Tissue Growth Factor (CTGF; green), a soluble pro-fibrotic mediator driving activation of myofibroblasts. As suggested by transcriptional profiling of macrophages in regeneration and scar formation (Fig. 1h), CTGF is expressed widely by macrophages in the infarct zone of the P7 scar-forming heart (j), but minimally by macrophages in the P1 site of injury (k) (Representative images of n = 3 per group, scale bar: 100 μm).

Acknowledgments
This image is the copyrighted work of the attributed author or publisher, and ZFIN has permission only to display this image to its users. Additional permissions should be obtained from the applicable author or publisher of the image. Full text @ Nat. Commun.