
|
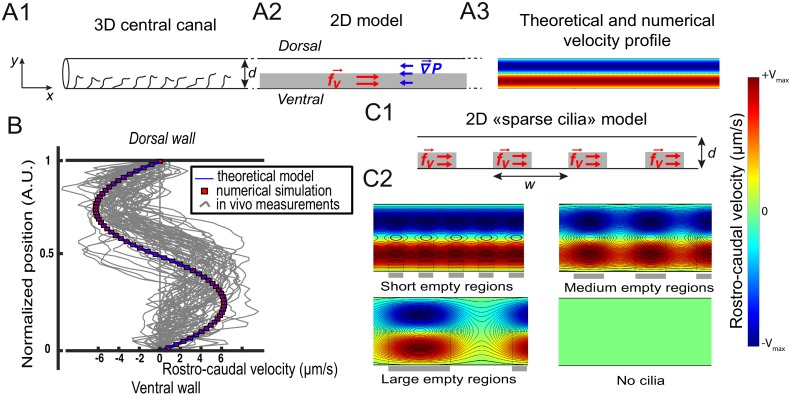
Figure 3 Theoretical and numerical results explain how motile cilia generate local CSF flow in 30 hpf embryos. (A1) Schematic of the three-dimensional central canal that can be reduced to a quasi-cylinder whose ventral wall is paved by regularly positioned motile cilia, and whose dorsal wall is composed of more loosely distributed passive cilia. (A2) The model reduces the geometry to a bidimensional channel of thickness d, composed of two main regions occupying the ventral and dorsal halves of the channel. In the ventral region, the cilia contribution is modeled as a constant bulk force. A constant gradient of pressure, present in the whole central canal, opposes the cilia-induced force and ensures a global zero flux on a cross section. (A3) Numerically and theoretically calculated velocity maps, where dark blue represents highest rostral velocities (negative values), while dark red holds for the highest caudal velocities (positive values). (B) Numerical (red squares) and theoretical (blue line) velocity profiles, composed of two parabolas matched at the center of the cross-section (Relative position = 0.5). They are convincingly compared to a superimposition of in vivo measurements obtained on 57 WT siblings. (C1) ‘Sparse cilia’ model, accounting for the spatially inhomogeneous defects in cilia structure or motility (as observed in some mutants with defective cilia). The model reduces these defects to regions in the ventral side that are fully passive and where no force applies. Numerical simulations enable to derive the flow with an arbitrary distribution of these passive regions. (C2) Maps of characteristic streamlines obtained for various aspect ratios w/d of the repeat units. Small passive regions show most of the streamlines parallel to the walls. A central recirculation, or vortex, is gradually more present in between cilia regions as the lateral extension of the passive region increases. The corresponding distribution of pressure in the central canal for these different cases is represented in Figure 3—figure supplement 1.