
|
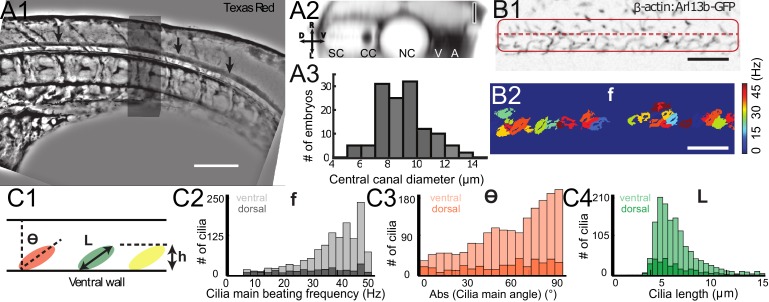
Figure 2 Geometry of the central canal and properties of motile cilia in 30 hpf embryos. (A1, A2) Central canal filled with TexasRed injected in the brain ventricles shown laterally from maximal Z-projection stack of 75 inverted contrast images acquired with 1 μm Z-step (A1) and corresponding vertical profile (A2, 5x rescale on the axial dimension enabled similar pixel size in X/Y and Z): SC, spinal cord, CC, central canal (black arrows in (A1)), NC, notochord, V, vein and A, artery. (A3) Histogram of central canal diameter from n = 129 WT embryos, with a median value of 8.9 ± 0.9 μm (mean ± 0.5 s.t.d.). (B1, B2) Lateral view in the CC where cilia are labeled with GFP in Tg (β-actin:Arl13b-GFP) transgenic embryos (B1) used to draw a map of local main beating frequency (B2) from the fluorescence signal obtained by calculating the local Fourier transform. Regions of constant frequency are color-coded and most likely correspond to single cilium beating. (C1) Scheme presenting some parameters of interest extracted from regions of constant frequency obtained in (B2) and fitted as ellipses to obtain their mean orientation Θ, their major axis (L), associated with the cilia maximal length, and their height (h), that is their projection along the D-V axis. The latter parameter gives the portion of central canal occupied by beating cilia. (C2, C3, C4) Histograms of parameters extracted in many regions of constant frequency of n = 89 Tg(β-actin: Arl13b-GFP) 30 hpf embryos, for a total of 1704 motile cilia (298 dorsal cilia and 1406 ventral cilia) analyzed in total. A central frequency of 38.1 Hz (median frequency with s.d 10.0 Hz) (C2), a mean absolute orientation |Θ| 62.6° (s.d. 23.4°) (c3), a length L of 5.8 μm (s.d. 2.0 μm) (C4) as well as a beating height of 2.7 μm (s.d. 1.9 μm) (not shown) were found for ventral cilia. Dorsal motile cilia have a central frequency of 32.3 Hz ± 12.3 Hz, a caudal orientation of absolute value 59.7°± 25.8° and a length of 5.5 μm ± 3.0 μm. Scale bar is 50 μm in (A1), and 15 μm in (A2, B1, B2).