
Image
|
Figure Caption
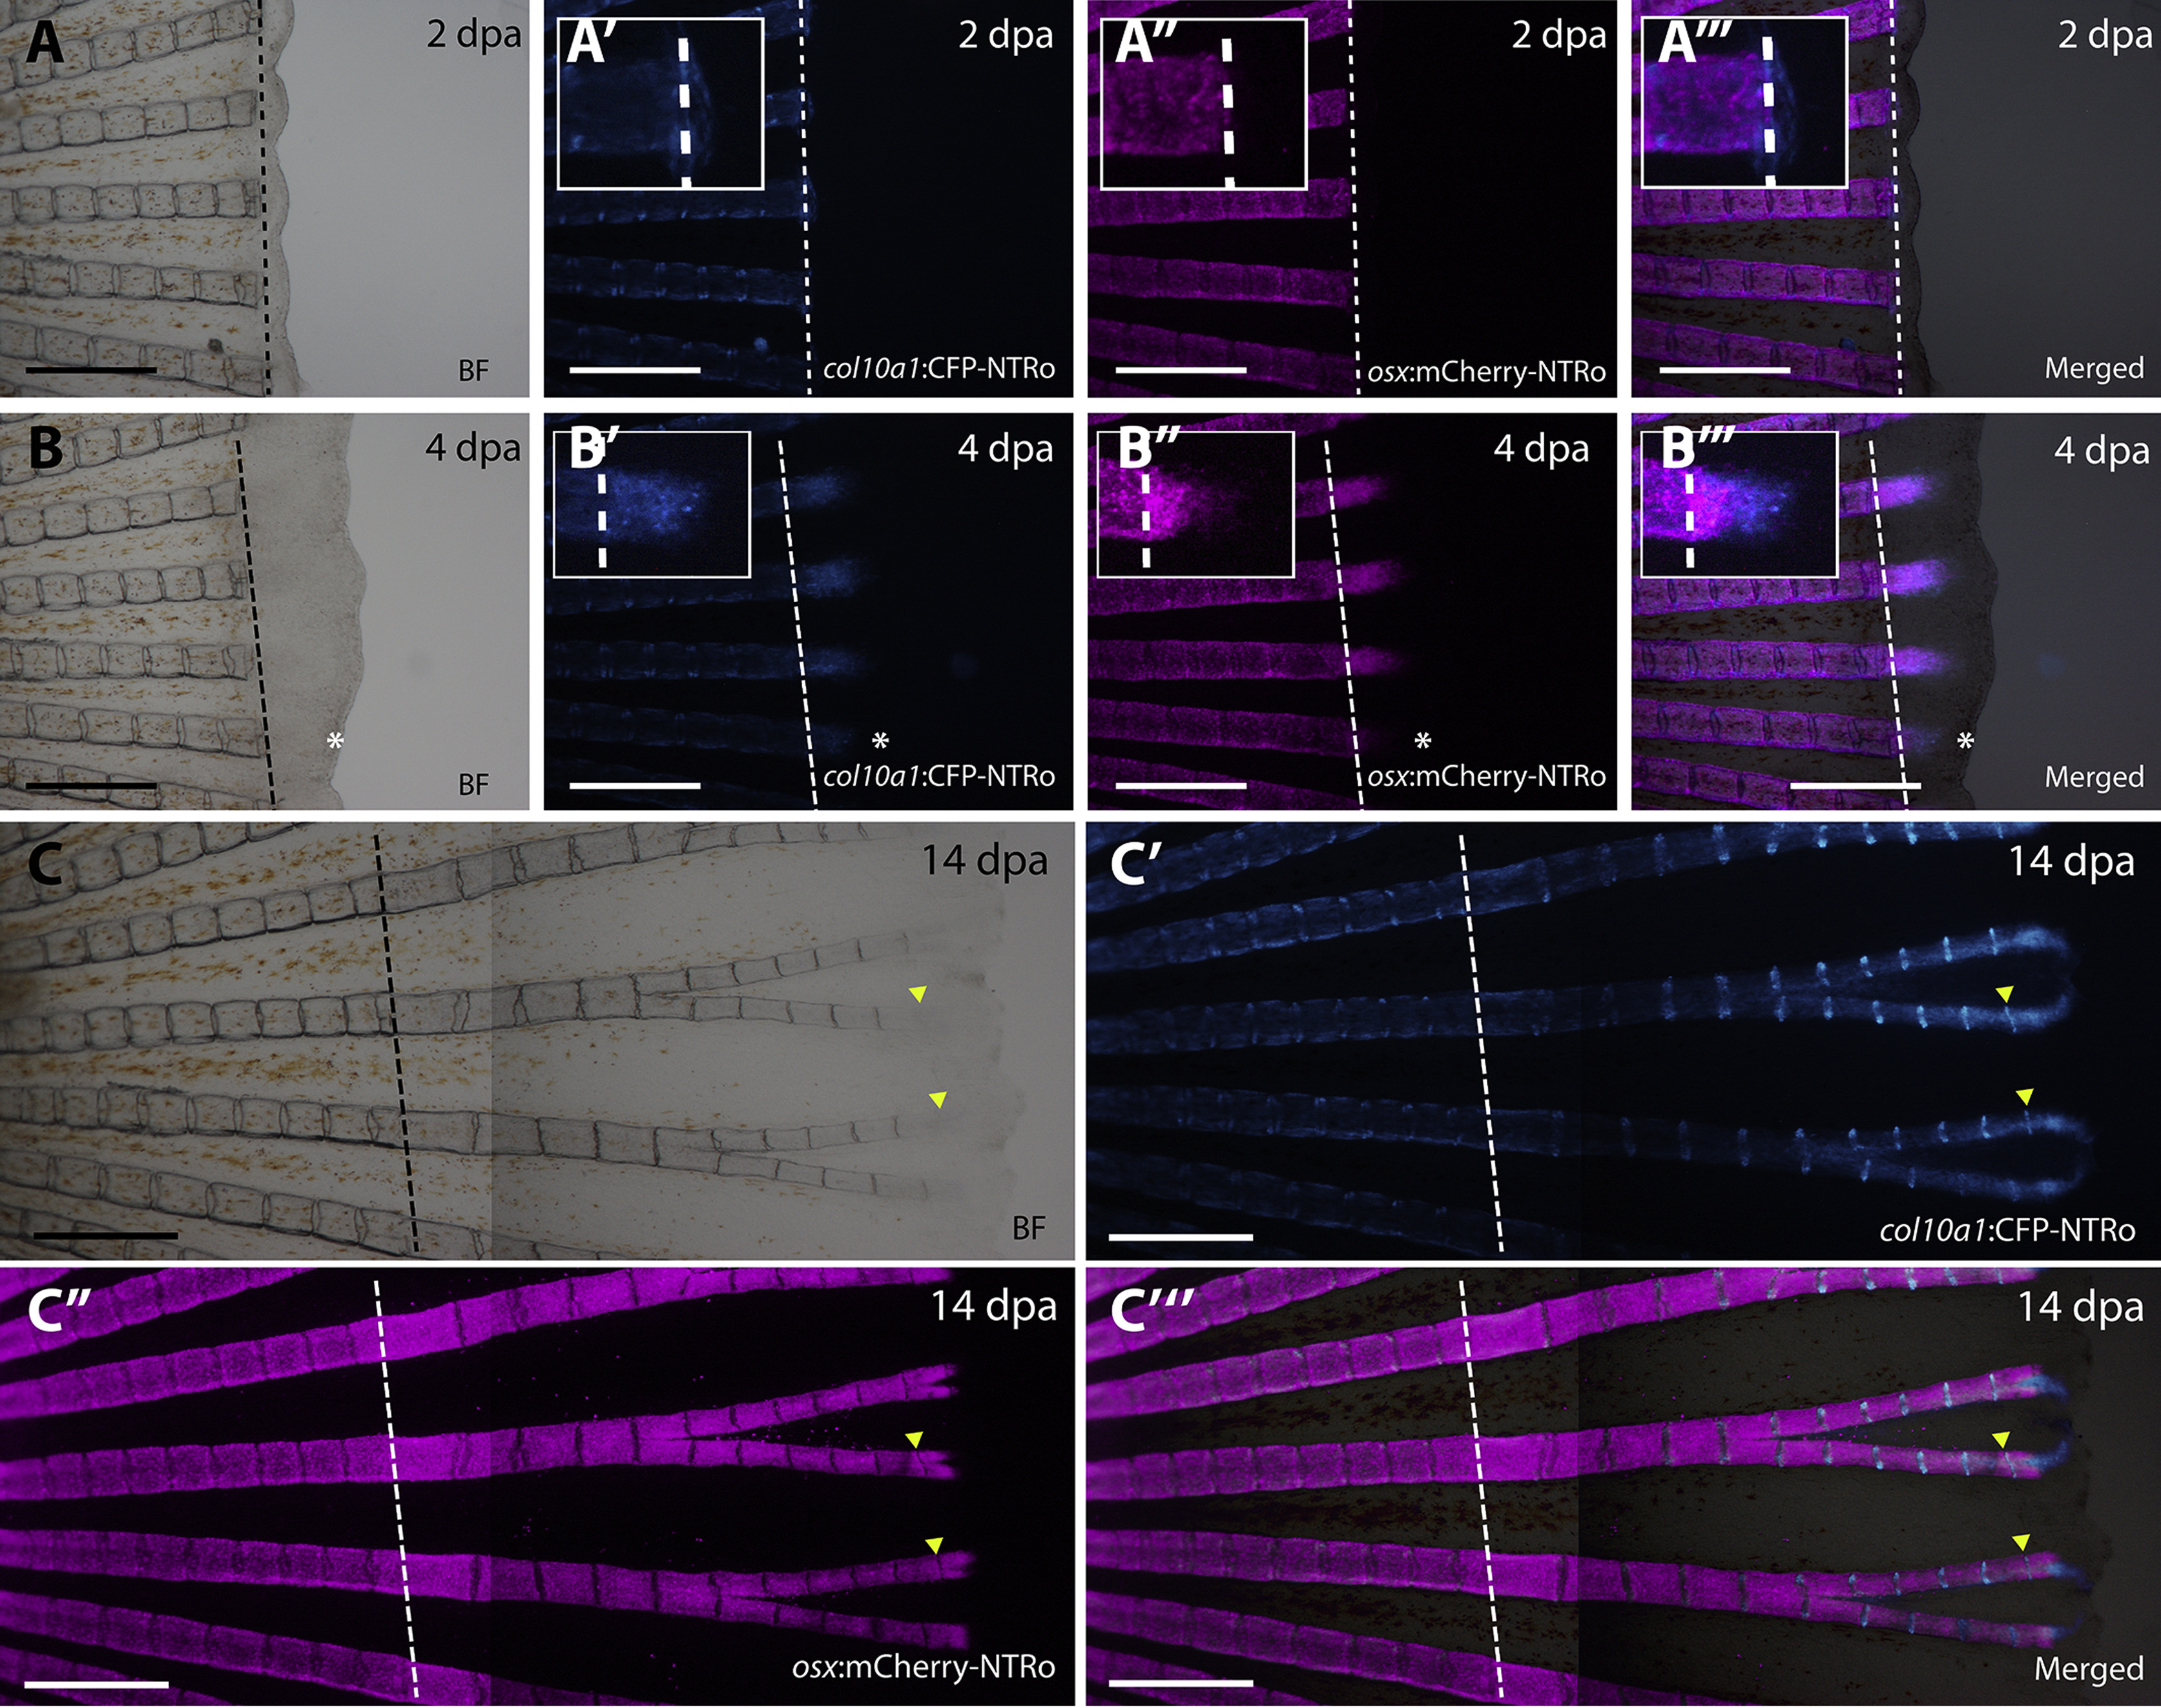
Fig. 3
Expression of col10a1:CFP-NTRo and osx:mCherry-NTRo during fin regeneration. Images of regenerating fin at 2 (A), 4 (B) and 14 (C) days post amputation (dpa) showing bright field images (A, B, C), CFP expression (A′, B′, C′), mCherry expression (A″, B″, C″) and merged images (A‴, B‴, C″, C‴). Insets in (A,B) show higher magnification views of individual blastema regions indicated by asterisks (in B-B’’’). Dotted line indicates amputation plane. Scale bars = 0.5 mm.
Acknowledgments
This image is the copyrighted work of the attributed author or publisher, and
ZFIN has permission only to display this image to its users.
Additional permissions should be obtained from the applicable author or publisher of the image.
Reprinted from Developmental Biology, 455(1), Dasyani, M., Tan, W.H., Sundaram, S., Imangali, N., Centanin, L., Wittbrodt, J., Winkler, C., Lineage tracing of col10a1 cells identifies distinct progenitor populations for osteoblasts and joint cells in the regenerating fin of medaka (Oryzias latipes), 85-99, Copyright (2019) with permission from Elsevier. Full text @ Dev. Biol.