
Image
|
Figure Caption
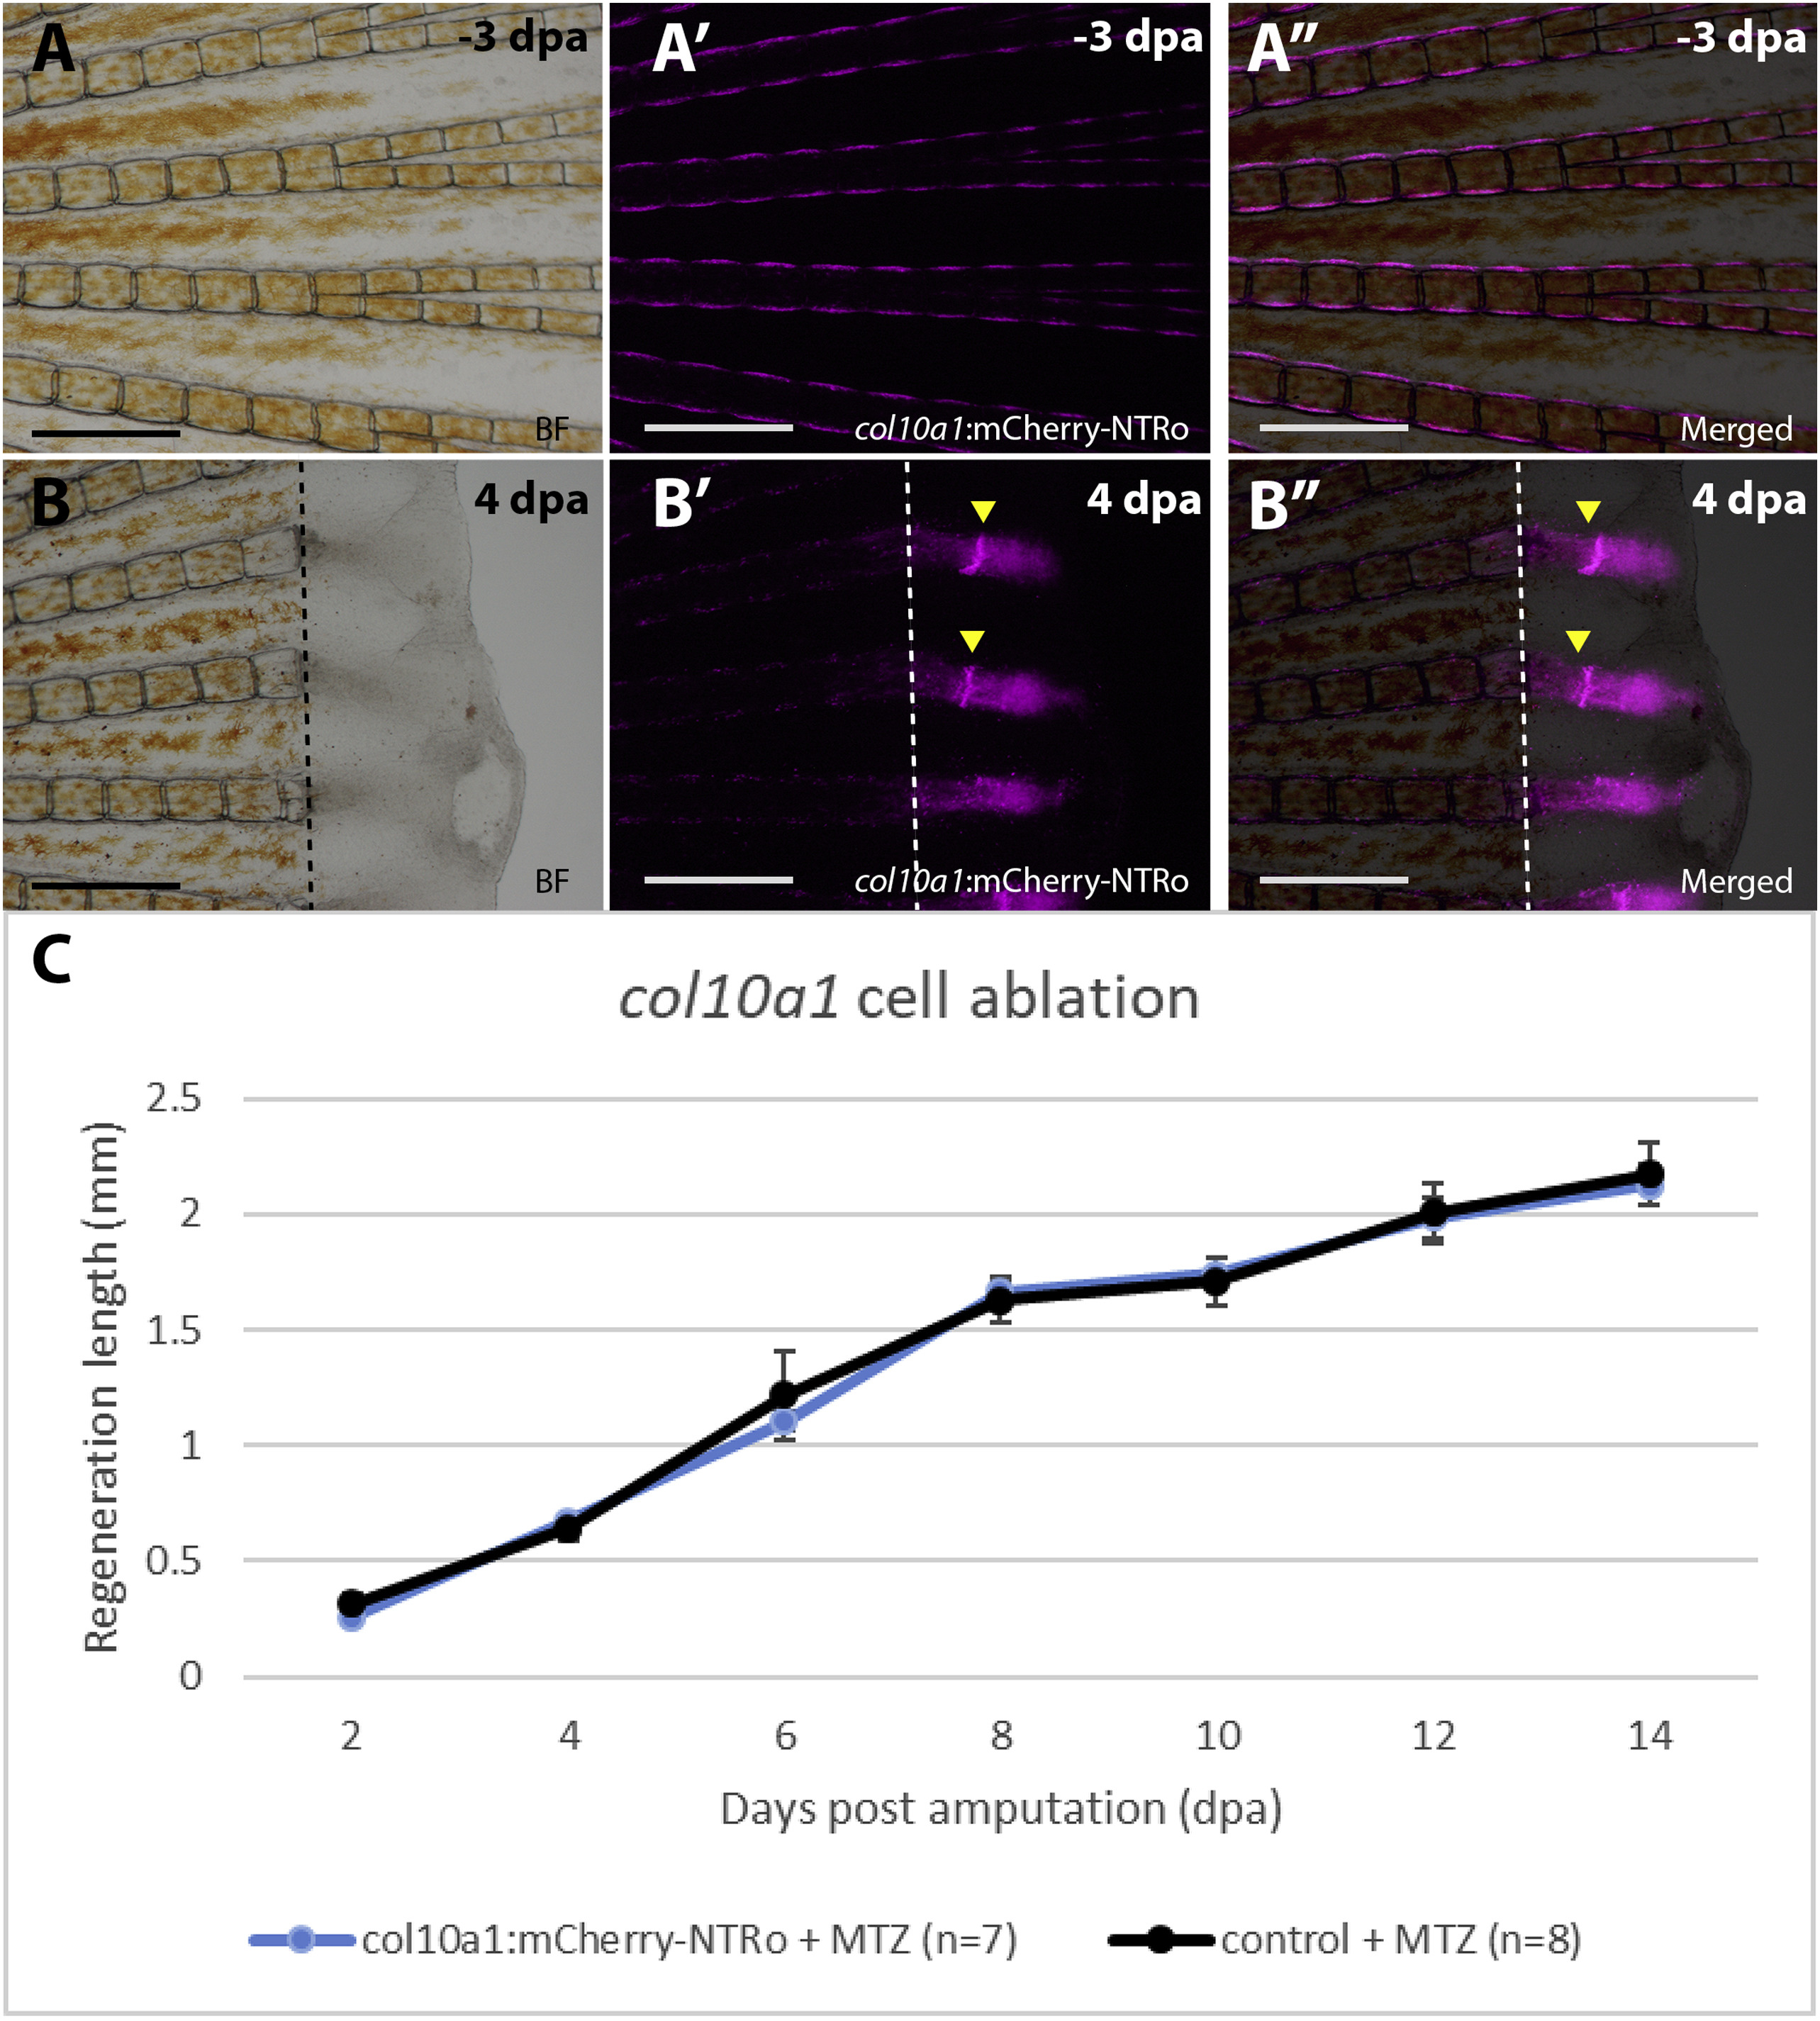
Fig. 6
Fin regeneration after col10a1 cell ablation. A,B: Images of fins before treatment (A) and regenerates at 4 dpa (B) showing bright field (A,B), col10a1:mCherry-NTRo expressing cells (A′,B′) and merged images (A″,B″). Arrowheads indicate col10a1:mCherry-NTRo positive cells in the regenerating intersegmental region. Scale bars = 0.5 mm. C: Average lengths of regenerates at different time points. Col10a1 cell ablated fish show a similar rate of fin regeneration as compared to control siblings treated with Mtz. Data are represented as mean ± SEM.
Acknowledgments
This image is the copyrighted work of the attributed author or publisher, and
ZFIN has permission only to display this image to its users.
Additional permissions should be obtained from the applicable author or publisher of the image.
Reprinted from Developmental Biology, 455(1), Dasyani, M., Tan, W.H., Sundaram, S., Imangali, N., Centanin, L., Wittbrodt, J., Winkler, C., Lineage tracing of col10a1 cells identifies distinct progenitor populations for osteoblasts and joint cells in the regenerating fin of medaka (Oryzias latipes), 85-99, Copyright (2019) with permission from Elsevier. Full text @ Dev. Biol.