IMAGE

Fig. 6

ID
ZDB-IMAGE-200130-12
Genes
Source
Figures for Huning et al., 2020
Image
Figure Caption

Fig. 6

Analysis of specific gene knockdown in CRISPRi experiments. Quantitative RT-PCR was used to analyze relative levels of
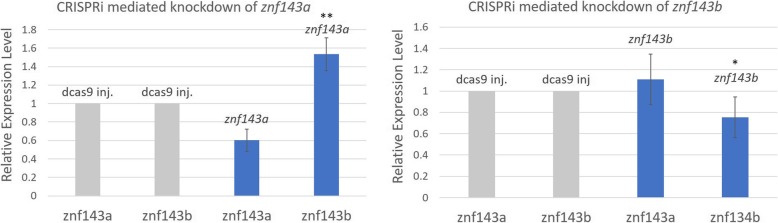
 znf143a and znf143b transcripts. The amounts of each znf143 cDNA were determined relative to those in the dCas9 injection control after normalization to the geometric mean of the widely-expressed transcripts (ef1α and rpl13α). The height of each column represents the mean of 4 or 5 independent injection experiments, and error bars represent standard deviation from the mean. A single asterisk signifies a p-value < 0.05 relative to the control sample lacking any sgRNAs, while a double asterisk signifies a p-value < 0.01

Figure Data
Acknowledgments
This image is the copyrighted work of the attributed author or publisher, and ZFIN has permission only to display this image to its users. Additional permissions should be obtained from the applicable author or publisher of the image. Full text @ BMC Mol Cell Biol