IMAGE

Figure 3

ID
ZDB-IMAGE-200129-30
Source
Figures for Yang et al., 2019
Image
Figure Caption

Figure 3

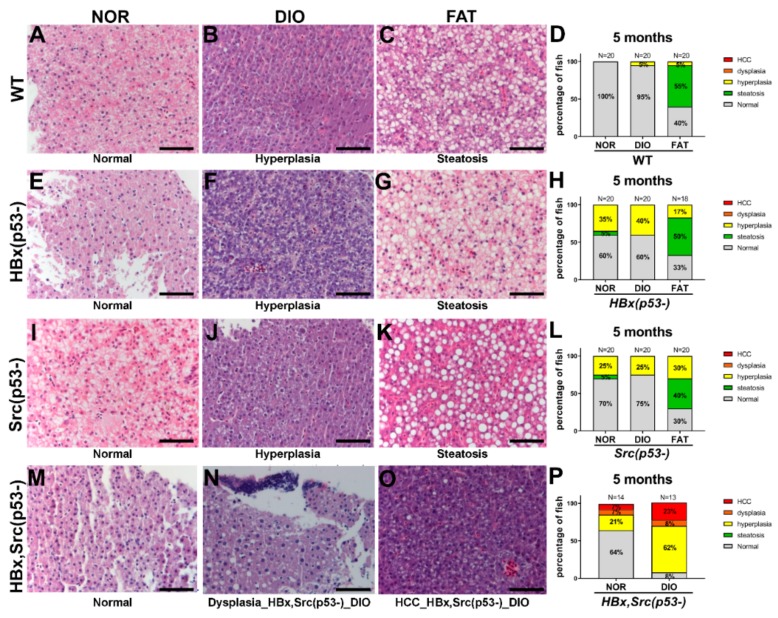
Histopathological changes in various genetic background zebrafish fed with different diets. Representative H&E stain images and histopathologic change statistics of (AD) WT, (EH) HBx(p53-), (IL) Src(p53-), and (MP) HBx, Src(p53-) fish after 8 weeks of normal diet (NOR), overfeeding (diet-induced obesity, DIO), or high-fat diet (FAT) starting at 3 months of age, and scarified at 5 months. The histopathologic change consists of percentages in five states: normal, steatosis, hyperplasia, dysplasia, and hepatocellular carcinoma (HCC). The number of fish is represented as N on top of each bar. The scale bar is 50 μm.

Figure Data
Acknowledgments
This image is the copyrighted work of the attributed author or publisher, and ZFIN has permission only to display this image to its users. Additional permissions should be obtained from the applicable author or publisher of the image. Full text @ Cancers