
|
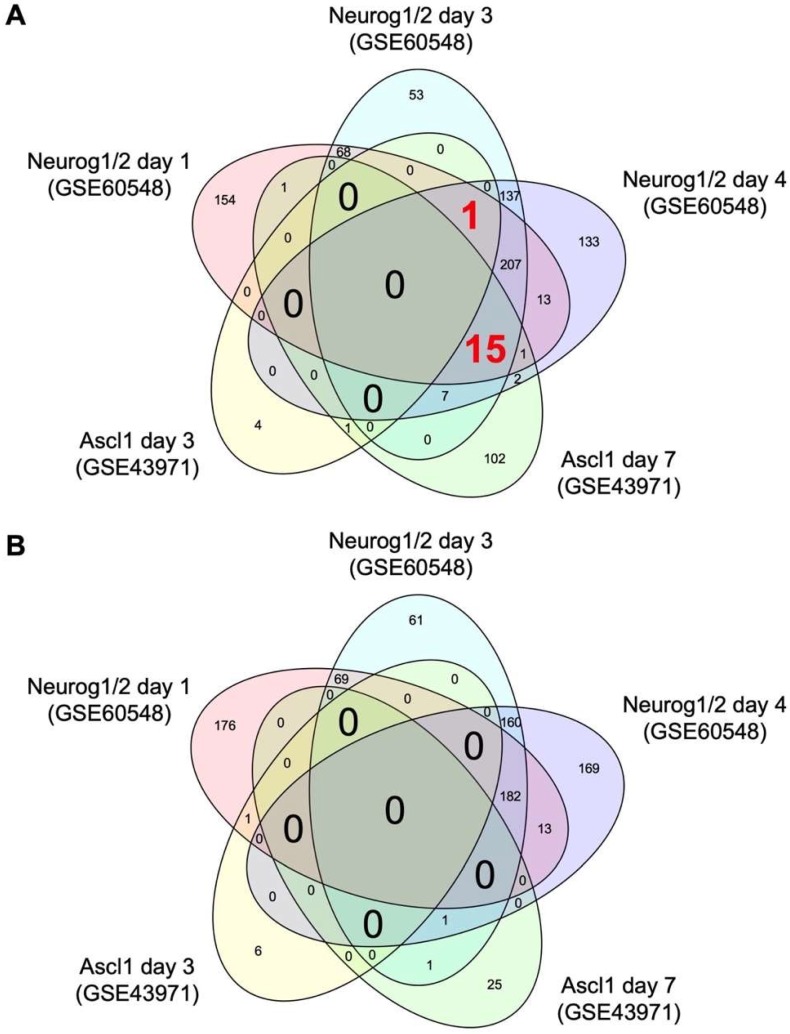
Figure 1
Venn diagrams of the number of differentially expressed genes regulated by Neurog1/2 and Ascl1. Transcriptome data of stem cells with and without overexpression of Neurog1/2 (GSE60548) or Ascl1 (GSE43971) were downloaded from a public database. Genes differentially expressed in stem cells on days 1, 3, and 4 post-induction of Neurog1/2 overexpression versus control cells, or on days 3 and 7 post-induction of Ascl1 overexpression versus control cells were identified using a false discovery rate threshold of 10%. The number of genes increased (