
Image
|
Figure Caption
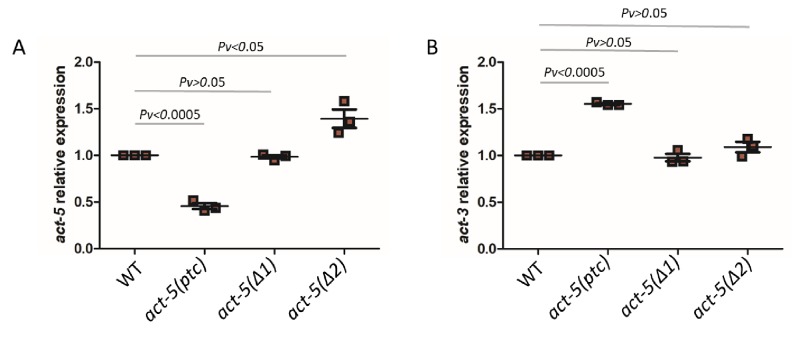
Figure 1 mRNA levels of act-5 and act-3 in WT and mutant alleles. qPCR analysis of act-5 (A) and act-3 (B) mRNA levels in WT and act-5(ptc), act-5(Δ1), and act-5(Δ2) mutants. act-3 mRNA levels are upregulated when act-5 mutant mRNA levels are reduced (i.e., only in the act-5(ptc) allele). WT expression levels are set at 1. Data are mean ± S.E.M.; average dCt values are shown in Figure 1—source data 1. Two-tailed Student’s t-test was used to calculate P values
Acknowledgments
This image is the copyrighted work of the attributed author or publisher, and
ZFIN has permission only to display this image to its users.
Additional permissions should be obtained from the applicable author or publisher of the image.
Full text @ Elife