
Fig. 3
- ID
- ZDB-IMAGE-200121-1
- Publication
- Ahsan et al., 2019 - Prickle1 is required for EMT and migration of zebrafish cranial neural crest
- All Figures
- Figures for Ahsan et al., 2019
|
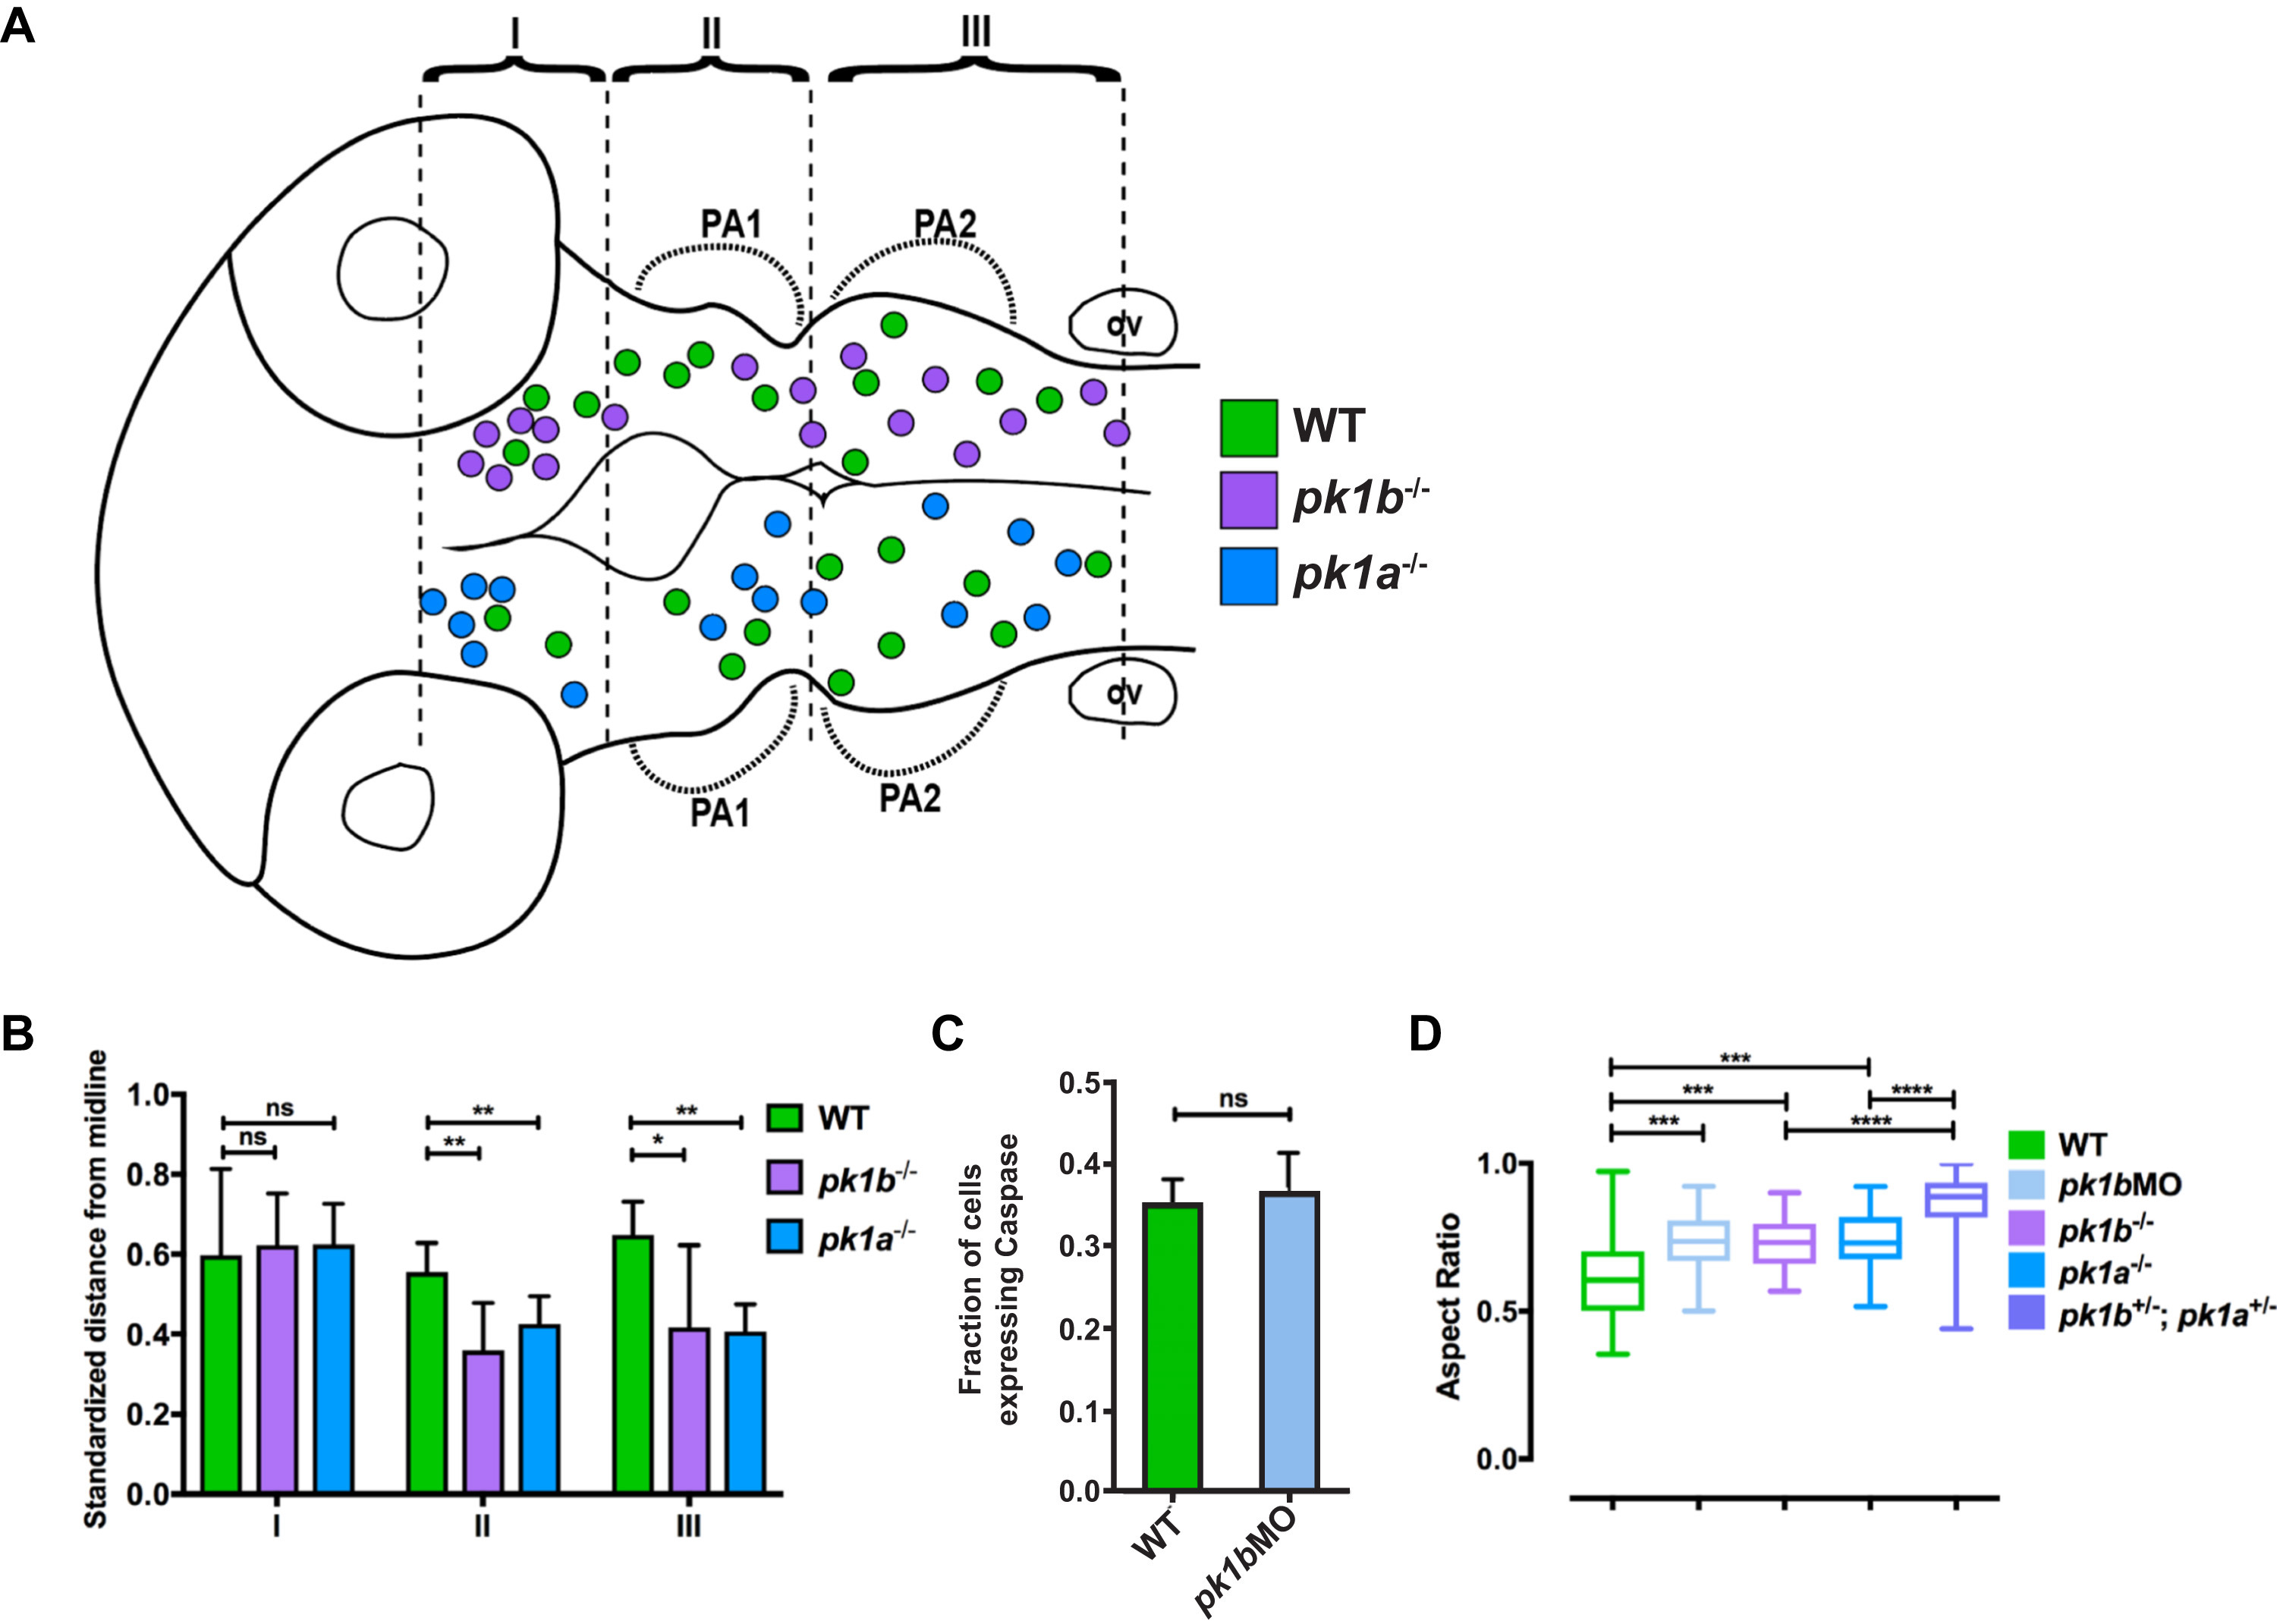
Fig. 3
Additional analysis of cranial neural crest cell clusters in wild-type and pk1 mutant embryos. (A-B) The spatial distribution of NCC clusters across multiple 24 hpf embryos shows that both pk1b fh122/ fh122 and pk1ach105/ch105 clusters show anterior and medial biases. (A) The centroids of cell clusters, defined as two or more cells in contact with one another, across multiple pk1b fh122/ fh122 specimens (n = 5 embryos) are plotted above the midline and those of pk1ach105/ch105 specimens (n = 5 embryos) are plotted below the midline, with WT clusters on both sides for comparison (green filled circles, n = 5 embryos). There is a bias for both pk1b fh122/ fh122 and pk1ach105/ch105 clusters in region 1 (R1), as well as a tendency to misalign such that the cluster cannot be ascribed to distinct streams for either PA1 or PA2. (B) Normalized distances of centroids of clusters from the midline show that in both RII and RIII there is a tendency for pk1b fh122/ fh122 and pk1ach105/ch105 NCCs to be located medially as compared to WT NCCs. The bias was found to be statistically significant for regions II and III using a two-way ANOVA test (*, p < 0.05, **, p < 0.01) for either mutant conditions as compared to WT. There was no statistically significant difference between either mutant condition and WT in Region I (p > 0.05). (C) Comparison of the fraction of NCCs in a given z-slice that expresses Caspase-3 in 24 hpf WT (n = 78 cells, 3 embryos) versus 24 hpf pk1b-morphant (n = 172 cells, 5 embryos) specimens. No statistically-significant difference was found between WT and pk1b-morphant NCCs (p > 0.05). (D) Measurements of aspect ratio (the ratio of width/length of NCCs) for WT (n = 34 cells), pk1b-morphant (n = 48 cells), pk1b fh122/ fh122 (n = 40 cells), pk1ach105/ch105 (n = 30 cells), and double-heterozygous pk1ach105/+; pk1bfh122/+ (n = 94 cells) 24 hpf specimens were performed by measuring the width versus length ratio of NCCs either in Tg(sox10:mRFP) embryos, which label the membranes of all NCCs, or in Tg(sox10:EGFP) embryos co-injected with RNA encoding mRFP. WT NCCs had lower aspect ratios in comparison to each Pk1-deficient condition. Statistical significance was calculated in each pairwise case using unpaired t-tests (***, p < 0.001; ****, p < 0.0001). Double-heterozygous pk1ach105/+; pk1bfh122/+ embryos showed a significantly higher aspect ratio than either pk1b fh122/ fh122 or pk1ach105/ch105 alone (p < 0.0001 in both cases).
Reprinted from Developmental Biology, 448(1), Ahsan, K., Singh, N., Rocha, M., Huang, C., Prince, V.E., Prickle1 is required for EMT and migration of zebrafish cranial neural crest, 16-35, Copyright (2019) with permission from Elsevier. Full text @ Dev. Biol.