IMAGE

Fig. 5.

ID
ZDB-IMAGE-200116-5
Source
Figures for Rissone et al., 2019
Image
Figure Caption

Fig. 5.

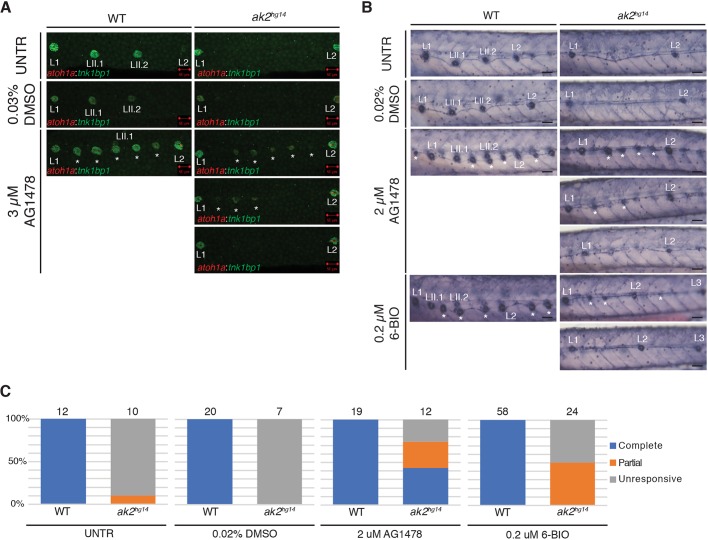
ak2 deficiency impairs IC neuromast formation. (A,B) Chemical treatments of ak2hg14 mutants and their control siblings (WT) with AG1478 or 6-BIO. (A) Confocal analysis at 5 dpf of trunk regions for untreated, 0.03% DMSO or 3 µM AG1478-treated embryos in the Tg(tnks1bp1:EGFP; atoh1a:dTOM) transgenic background. Scale bars: 50 µm. (B) Alkaline phosphatase staining of 5 dpf ak2hg14 and control embryos untreated or treated with 0.02% DMSO, 2 µM AG1478 or 0.2 µM 6-BIO compounds. White asterisks indicate IC neuromasts. Scale bars: 50 μm. (C) Quantification of the effect of AG1478 or 6-BIO treatments in inducing the formation of ectopic ICs in ak2hg14 homozygous mutants and their control siblings. The total number of embryos analyzed per genotype is indicated above each bar.

Figure Data
Acknowledgments
This image is the copyrighted work of the attributed author or publisher, and ZFIN has permission only to display this image to its users. Additional permissions should be obtained from the applicable author or publisher of the image. Full text @ Dis. Model. Mech.