IMAGE

Figure 5

ID
ZDB-IMAGE-200115-6
Source
Figures for Metzner et al., 2020
Image
Figure Caption

Figure 5

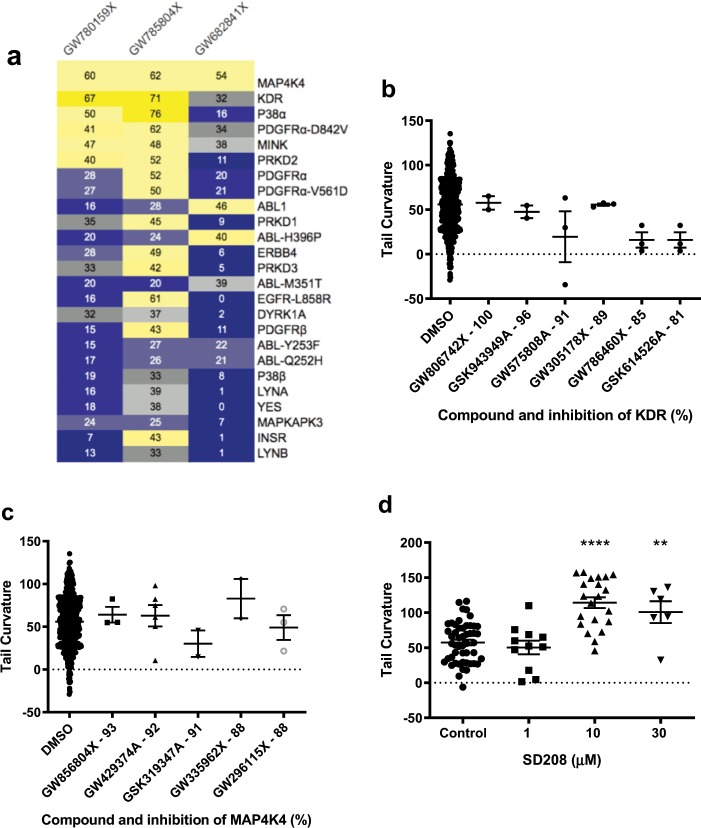
Identification of ALK5 as a pkd2−/− phenotype modulator in zebrafish. (a) Heat maps of known kinases inhibited by PKIS repressor compounds with the top 25 inhibited kinase targets in decreasing order. Numbers represent percentage of inhibition; dark yellow ≥65%, yellow ≥40%, light grey 35–40%, dark grey 30–35%, grey/blue 20–30%, light blue 15–20% and dark blue >15%. (b) Effects of potent KDR and (c) MAP4K4 inhibitors on pkd2−/− zebrafish embryo tail curvature. All compounds tested at 10 µM. Results represented by mean ± SEM. No significance via one-way ANOVA and Dunnett’s multiple comparison. (d) Effects of different concentrations of the ALK5 inhibitor SD208 on pkd2−/− curvature. Results represented by mean ± SEM. Significance via one-way ANOVA and Dunnett’s multiple comparison, p values represented by * (****p ≤ 0.0001, ***p ≤ 0.001, **p ≤ 0.01, *p ≤ 0.05 and non-significant (ns): p > 0.05).

Figure Data
Acknowledgments
This image is the copyrighted work of the attributed author or publisher, and ZFIN has permission only to display this image to its users. Additional permissions should be obtained from the applicable author or publisher of the image. Full text @ Sci. Rep.