
|
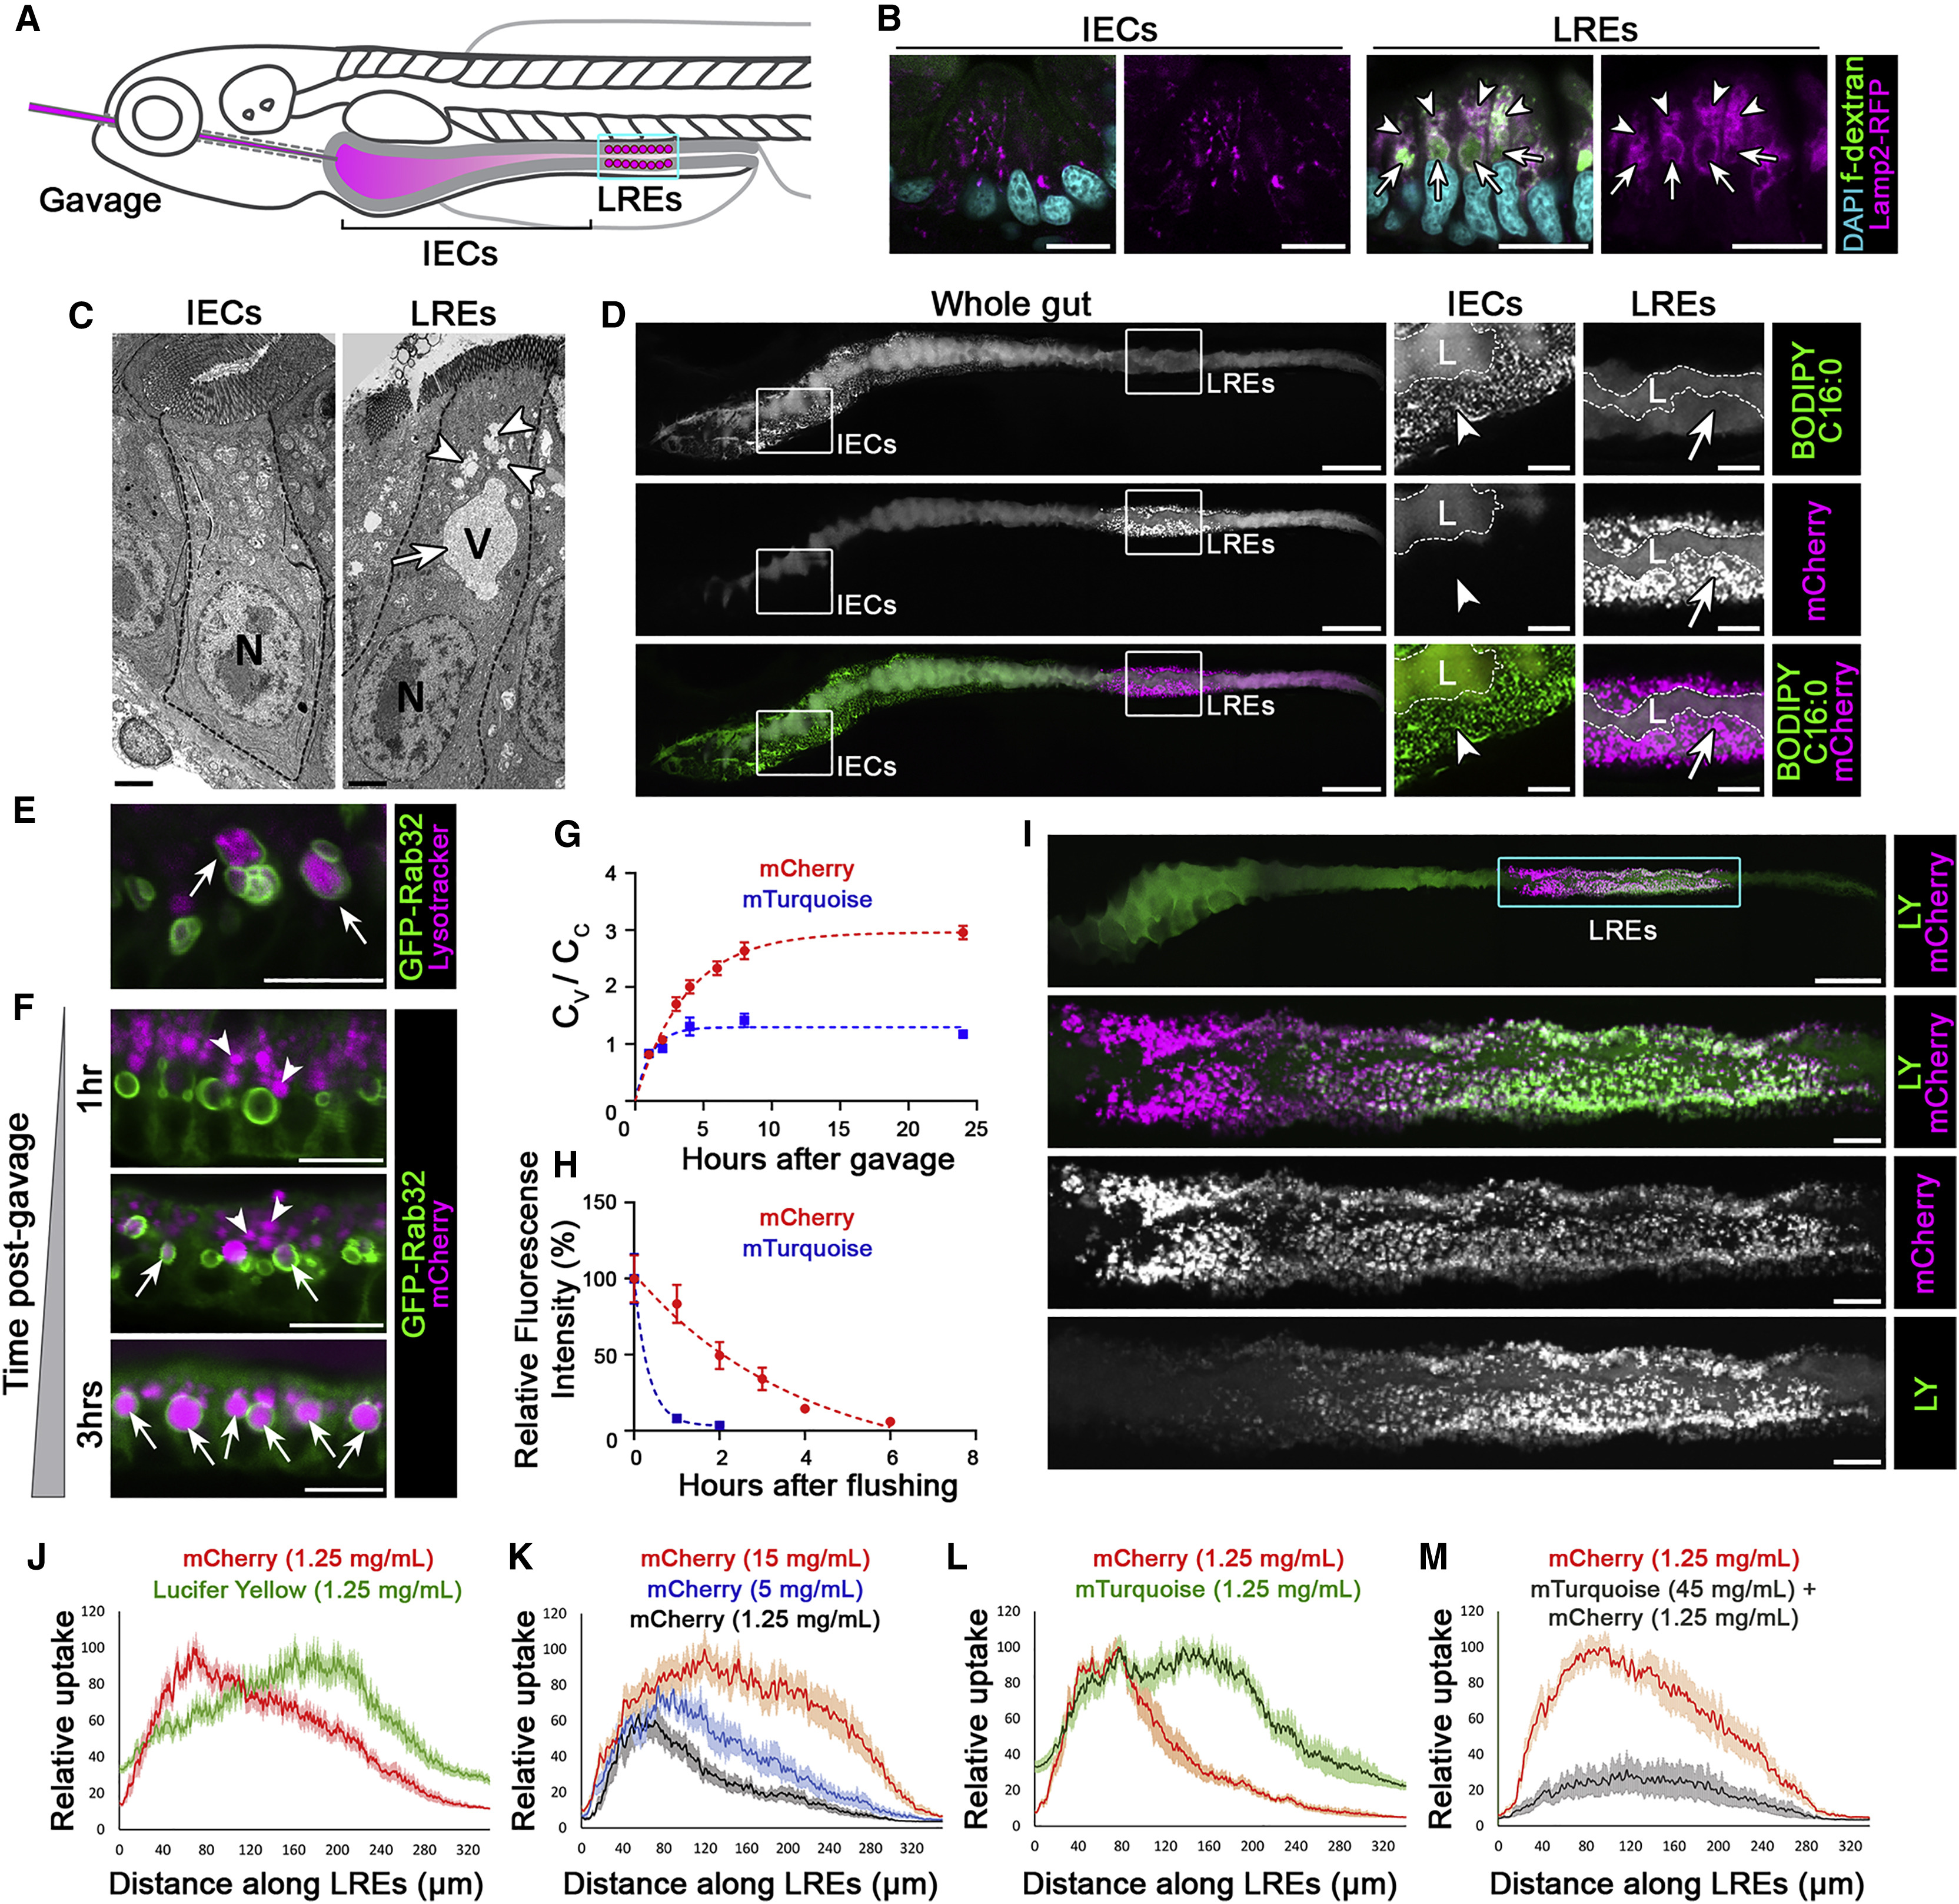
Fig. 1
Luminal Proteins Are Internalized and Digested Intracellularly by LREs in the Zebrafish Intestine
(A) Cartoon depicting gavage approach for studying luminal cargo uptake into LREs (cyan box) in the larval zebrafish intestine.
(B) Confocal images of cross sections of intestinal segments showing IECs and LREs from a 6 dpf larva following gavage with fluorescent dextran (fDex). Lamp2 is highly expressed in LREs and localizes to endosomes (arrowheads) and lysosomal vacuoles (arrows) that accumulate internalized fDex. n ≥ 10 animals. Scale bars, 10 μm.
(C) EM images of an IEC and an LRE. Arrowheads mark endosomes and an arrow the lysosomal vacuole. N = nucleus; V = vacuole. n ≥ 5 animals. Scale bars, 2 μm.
(D) Live confocal images of a 6 dpf larval zebrafish intestine following gavage and internalization of BODIPY C16:0 and mCherry. IECs take lipids and LREs protein. L = lumen. Insets show magnified images marking lipid droplets (arrowheads) in IECs and lysosomal vacuoles in LREs (arrows). n = 5. Scale bars, 100 μm (whole gut images), 25 μm (magnified images).
(E) Live confocal images of LREs of 6 dpf larva expressing GFP-Rab32a 1 h after gavage with LysoTracker, which labels vacuoles (arrows). n ≥ 10 animals. Scale bar, 10 μm.
(F) Live confocal images of LREs of 6 dpf larvae expressing GFP-Rab32a that were gavaged with mCherry. Luminal protein (mCherry) was internalized, migrated through apical endosomes (arrowheads), and progressively accumulated in LRE vacuoles (arrows). Scale bars, 10 μm.
(G) Quantitation of mCherry and mTurquoise accumulation in LRE vacuoles (Cv) respect to total cellular mean pixel intensity (Cc) over time after gavaging with 1.25 mg/mL of mCherry or mTurquoise. Data are fitted with the model Cv/Cc = k_in/k_ex ∗(1−exp(−k_ex ∗ X)) where k_in is the vacuole internalization rate and k_ex is the degradation rate. n ≥ 28; LREs from at least 6 animals per timepoint.
(H) Quantitation of mCherry and mTurquoise degradation in LREs over time following gavage with 1.25 mg/mL mCherry or 5 mg/mL mTurquoise for 1 h. Data are fitted with one phase decay model (dotted lines). n ≥ 9 animals per timepoint.
(I) Live confocal image of a 6 dpf larva gavaged with lucifer yellow (LY) and mCherry. Cyan box indicates magnified inset of LREs in lower panels. Scale bar, 100 μm (whole gut image), 20 μm (magnified images).
(J) Internalization profiles of LY and mCherry along LREs (n = 12).
(K) Internalization profiles along LRE region following gavage with increasing concentrations of mCherry: 1.25 mg/mL (n = 7), 5 mg/mL (n = 8), 15 mg/mL (n = 9).
(L) Internalization profiles along LRE region of mCherry and mTurquoise (n = 8).
(M) Internalization profiles along LRE region of mCherry following gavage with either mCherry alone (n = 7) or both mCherry + excess mTurquoise to outcompete mCherry uptake (n = 7). Data are means ± S.E.M. in (G), (H), and (J–M). Whole gut images in (D) and (I) are digitally stitched. See also Figures S1–S3.
Reprinted from Developmental Cell, 51(1), Park, J., Levic, D.S., Sumigray, K.D., Bagwell, J., Eroglu, O., Block, C.L., Eroglu, C., Barry, R., Lickwar, C.R., Rawls, J.F., Watts, S.A., Lechler, T., Bagnat, M., Lysosome-Rich Enterocytes Mediate Protein Absorption in the Vertebrate Gut, 7-20.e6, Copyright (2019) with permission from Elsevier. Full text @ Dev. Cell