IMAGE

Figure 4

ID
ZDB-IMAGE-200115-4
Source
Figures for Metzner et al., 2020
Image
Figure Caption

Figure 4

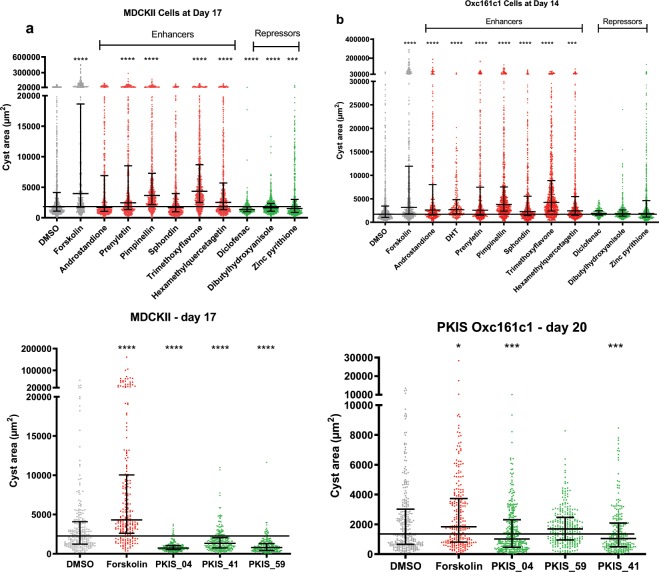
Chemical compounds and PKIS inhibitors identified from zebrafish screen in two cystic cell culture models, MDCKII and Ox161c1. Cyst area of MDCKII (a) and Ox161c1 (b) cells after 17 and 14 days of compound exposure respectively to compounds identified in the zebrafish screen. Chemical classes as indicated, concentrations determined via prior dose response assays to exclude toxicity. Cyst area of MDCKII (c) and Ox161c1 (d) cells after 17 and 20 days of compound exposure respectively to compounds identified in the zebrafish screen compared to DMSO control exposed cells. PKIS inhibitors as indicated at 10 µM concentrations and 5 µM forskolin. Results represented by median +/− IQR. P values represented by * (****p ≤ 0.0001, ***p ≤ 0.001, **p ≤ 0.01, *p ≤ 0.05 and non-significant (ns): p > 0.05.). Median of DMSO baseline indicated with black line and significances via Kruskal-Wallis test with Dunn’s multiple comparison.

Acknowledgments
This image is the copyrighted work of the attributed author or publisher, and ZFIN has permission only to display this image to its users. Additional permissions should be obtained from the applicable author or publisher of the image. Full text @ Sci. Rep.