IMAGE

Figure 3

ID
ZDB-IMAGE-200115-3
Source
Figures for Metzner et al., 2020
Image
Figure Caption

Figure 3

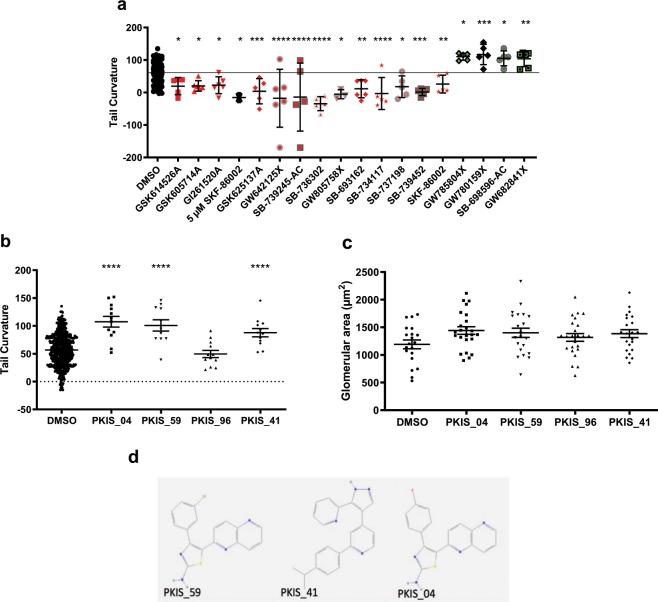
PKIS zebrafish screen revealed four PKIS repressors of the pkd2−/− phenotype. (a) Hit compounds identified from the PKIS library after initial compound screening and validation. Enhancers of pkd2 curvature in red, repressors in green. Mean of DMSO baseline indicated with black line. Effect of re-ordered PKIS repressor compounds on pkd2 curvature (b) and glomerular area (c). Statistical significances by one-way ANOVA with Dunnett’s multiple comparison, results represented by mean +/− SEM. P values represented by * (****p ≤ 0.0001, ***p ≤ 0.001, **p ≤ 0.01, *p ≤ 0.05 and non-significant (ns): p > 0.05.). (d) Chemical structure of the three validated PKIS tail curvature repressor compounds.

Figure Data
Acknowledgments
This image is the copyrighted work of the attributed author or publisher, and ZFIN has permission only to display this image to its users. Additional permissions should be obtained from the applicable author or publisher of the image. Full text @ Sci. Rep.