IMAGE

Figure 1

ID
ZDB-IMAGE-200115-1
Source
Figures for Metzner et al., 2020
Image
Figure Caption

Figure 1

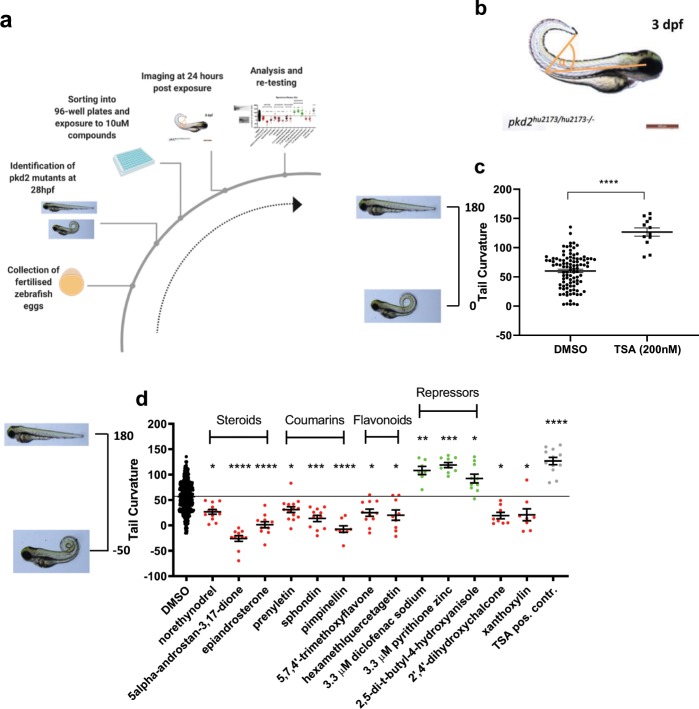
A high through-put zebrafish screen of pkd2−/− phenotype modulators. (a) Workflow of compound screen on pkd2 tail curvature phenotype. (b) pkd2−/− embryo at 3 dpf with schematic indication of curvature measurement. 180° - straight tail, 0° - tail crosses body axis. (c) Curvature analysis of pkd2 mutants exposed from 27 hpf to DMSO or 200 nM TSA. Example images of curvature next to y-axis. Significance via Mann-Whitney test; ****p ≤ 0.0001. (d) Combined data on hit compounds of the Spectrum library after initial compound screen, validation and cherry-picked compound exposures. Enhancers of pkd2 curvature in red, repressors in green. Representative tail curvature images on the left of results. Chemical classes as indicated. Mean of DMSO baseline indicated with black line. Significances via Kruskal-Wallis test; ****p ≤ 0.0001, ***p ≤ 0.001, **p ≤ 0.01, *p ≤ 0.05 and non-significant (ns): p > 0.05. (a) created using BioRender.com.

Figure Data
Acknowledgments
This image is the copyrighted work of the attributed author or publisher, and ZFIN has permission only to display this image to its users. Additional permissions should be obtained from the applicable author or publisher of the image. Full text @ Sci. Rep.