
|
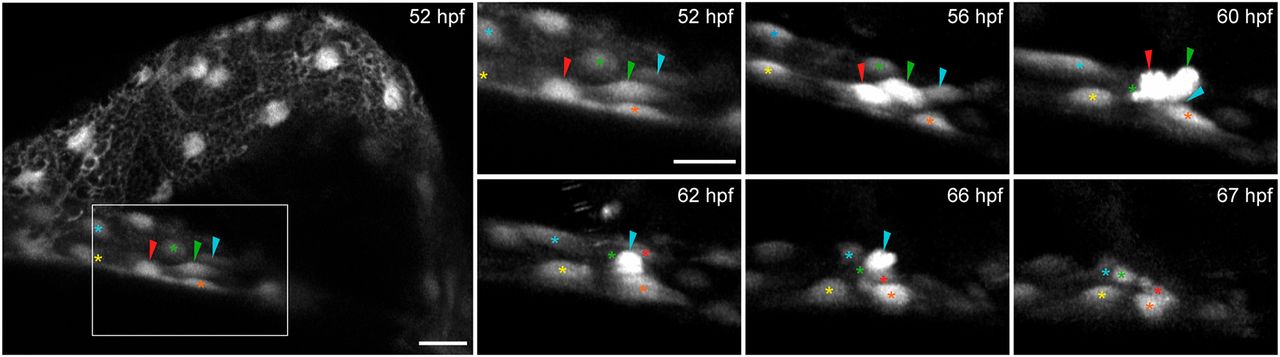
Fig. 3
Collective cell movements and apical extrusion lead to proepicardium delamination. epi:GFP embryo in vivo time lapse. Maximum intensity projection of 22 µm. Left panel, overview of the pericardial cavity at 52 hpf. Right panels, zoomed views of the dorsal pericardium (DP) during proepicardium (PE) formation. Shown are frames of the time lapse from 52 to 67 hpf. Colored arrowheads, emerging PE cells. Colored asterisks, DP cells surrounding PE cells (shown is one out of 10 observed events, see also Movie 3). hpf, hours post-fertilization. Images from one out of 10 embryo from five independent acquisitions. Scale bar: 20 µm; zoomed images, 10 µm.