
|
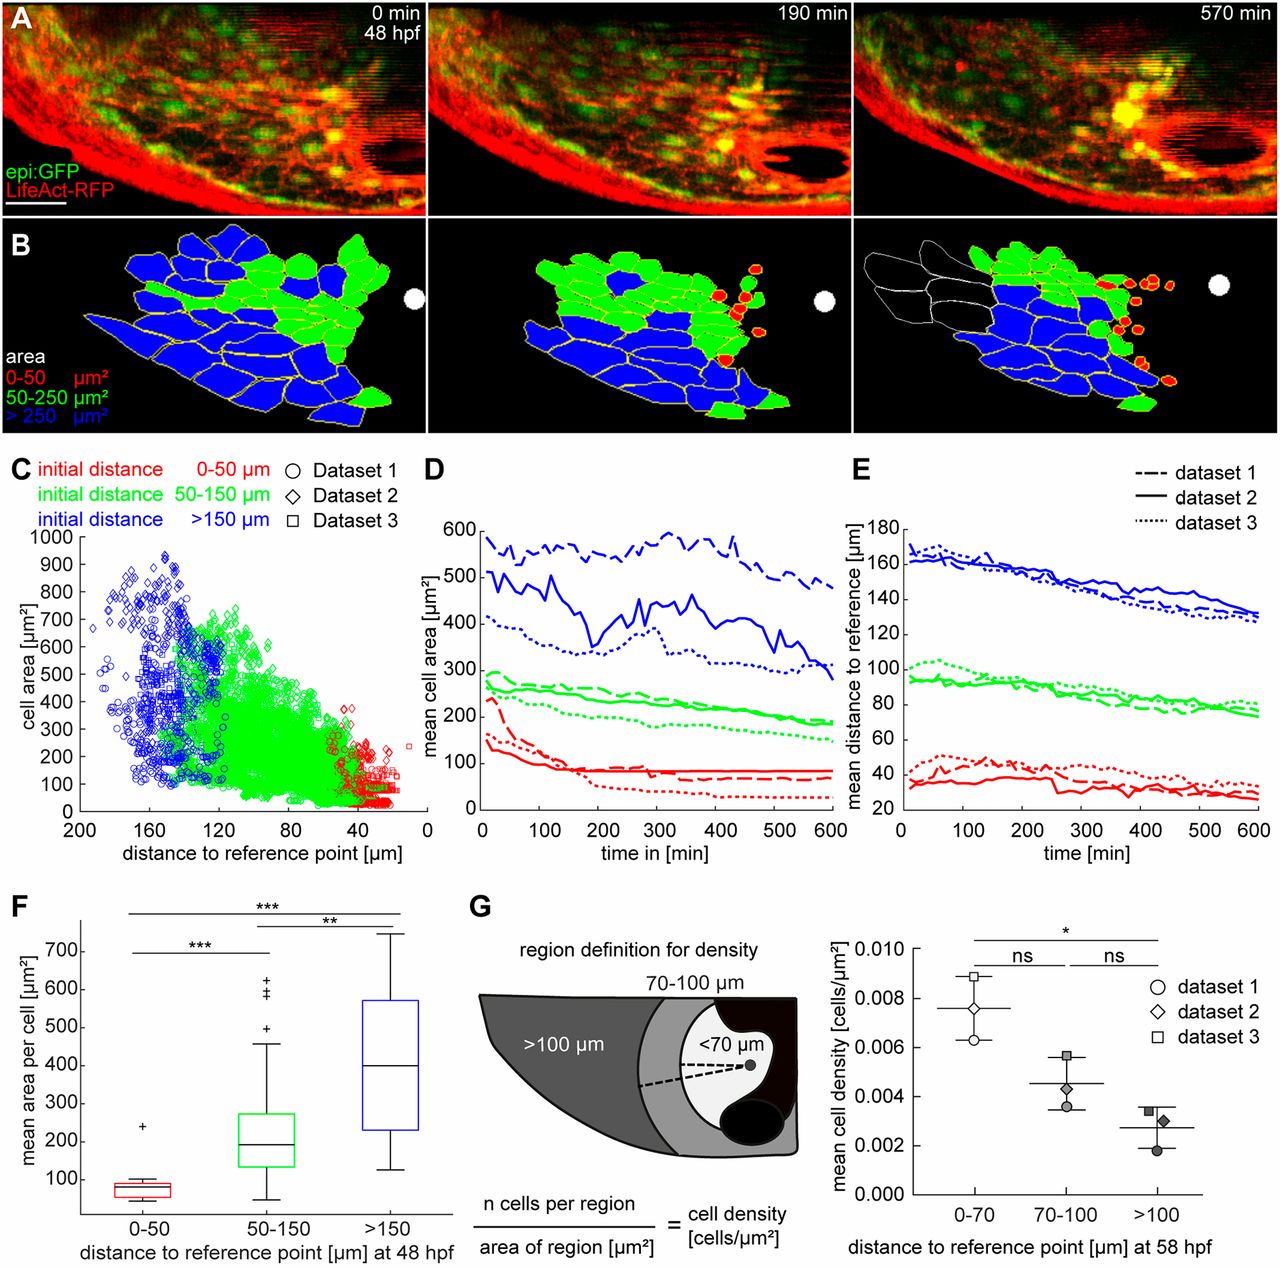
Fig. 2
Dorsal pericardial cells reduce their area during displacement to the midline. (A) Maximum intensity projections from a time lapse using epi:GFP; βactin:LifeAct-RFPe2212Tg embryos from 48 hpf onwards. LifeAct-RFP (red) signal shows F-actin. (B) Color-coded segmentation of 47 cell shapes from time series in A. Segmentation was repeated every 10 min in 60 subsequent time frames (n=3 animals). White spots indicate the reference point on the midline. Last frame shows white outline for cells not included in the quantification (see Movie 2). (C) The scatter plot shows the area of each cell per time point against the distance to the reference location. Color code represents the initial distance to the reference point. The mean distance is drawn against the distance to reference. (D,E) Graphs describe tracking and analysis of each cell from three datasets, with mean cell area (D) and mean distance of each cell (E) drawn against time. Each dataset is split into three categories according to the initial distance of a cell to the reference point, indicated by the color code. The line style indicates different datasets. (F) Data are sorted into categories by the initial distance to the reference point; each category is averaged and represented in a boxplot. The box represents the 25-75th percentiles, and the median is indicated. The whiskers show minimum and maximum of observed values. Outliers are indicated by crosses. (G) At the last time point (58 hpf), the mean cell density within the DP was calculated 70 µm, 100 µm and >100 µm from the reference point. The principle of measurement is schematically represented on the left. Areas in which the signal intensity is weak owing to the heart tube (black) were excluded from the quantification. Data are means±s.d.; Kruskal–Wallis test. ns, not significant; *P<0.05; **P<0.01; ***P<0.001. hpf, hours post-fertilization. DP digitally isolated in maximum intensity projections. Data from three out of six biological replicates from two independent acquisitions. Scale bar: 50 µm.