
|
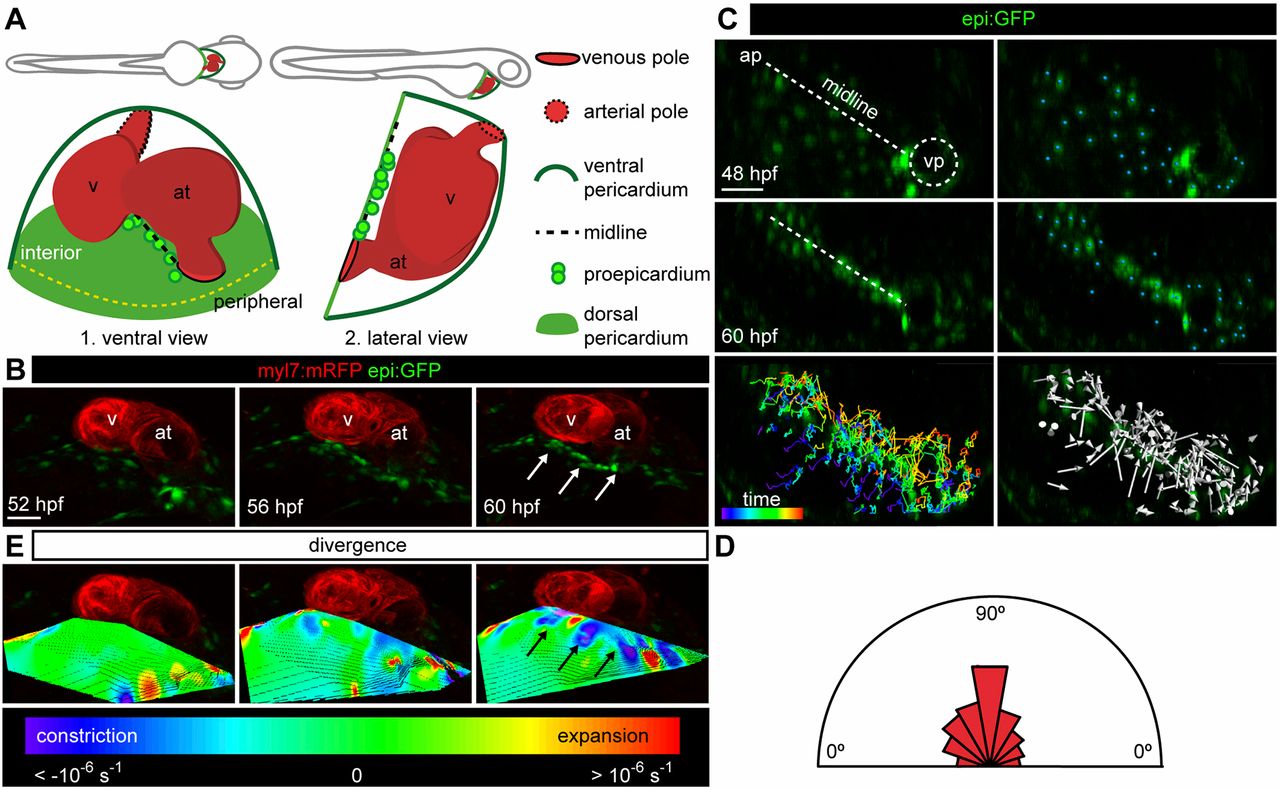
Fig. 1
Constriction of the dorsal pericardium precedes proepicardium formation. (A) Scheme of lateral and ventral views of a 60 hpf zebrafish embryo (top) and heart (bottom). The lateral view is rotated by −90°. (B) 3D ventral view of heart region in an epi:GFP; myl7:mRFP embryo. epi:GFP+ cells (green) are present in the dorsal pericardium (DP) and proepicardium (PE), myl7:mRFP+ cells (red) form the myocardium. 3D projections from in vivo time lapse at different time points are shown. White arrows point to PE cells (see Movie 1). (C) First and last frame of an in vivo time lapse of DP cells in an epi:GFP embryo; the midline is shown by a dashed white line, blue dots indicate tracked cells. Full colored tracks label the first time frame in purple and the last in red. Arrows indicate overall direction of tracked cells. (D) The half-rose diagram shows the movement angles of tracked cells relative to the midline. (E) 3D projection of the divergence field calculated for the time-lapse video above. The calculated divergence values are represented by colors; purple-blue regions represent constriction and red regions represent expansion. Black arrows point to PE cell clusters. ap, arterial pole; at, atrium; hpf, hours post-fertilization; v, ventricle; vp, venous pole. DP digitally isolated in 3D projections. Shown is data from one imaged animal representative of three biological replicates. Scale bars: 50 µm.