IMAGE

Figure 7

ID
ZDB-IMAGE-191230-964
Source
Figures for Kobayashi et al., 2019
Image
Figure Caption

Figure 7

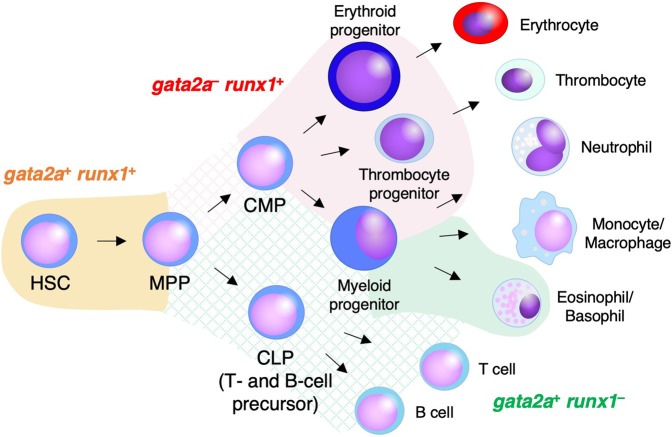
Hematopoietic differentiation in the zebrafish kidney. Schematic diagram of hematopoietic differentiation in the zebrafish kidney is shown. The orange, red, and green area denote the phenotypic transgene expression of gata2a:GFP and runx1:mCherry. Cross-hatched area shows the putative expression of gata2a:GFP and runx1:mCherry in hematopoietic progenitors. Long-term repopulating HSCs show gata2a+runx1+. In contrast, gata2arunx1+ cells are mostly erythroid- and thrombocyte-primed progenitors, but also some myeloid-primed progenitors. Additionally, some myeloid-primed progenitors are gata2a+runx1. Lymphoid-primed progenitors/precursors may express gata2a:GFP, but not runx1:mCherry.

Acknowledgments
This image is the copyrighted work of the attributed author or publisher, and ZFIN has permission only to display this image to its users. Additional permissions should be obtained from the applicable author or publisher of the image. Full text @ Sci. Rep.